

0.94–1.02 for the concentration of NAG3 were fitted to each
dataset individually, and the heats of dilution were fitted to each
dataset individually.
3.6 SPR
3.6.1 Immobilization
of HEWL
The aim is to immobilize HEWL on a carboxymethyl dextranderivatized SPR sensor chip (Biacore CM5). Standard amine coupling chemistry is used to immobilize the protein via lysine residues. The solutions, concentrations, contact times, and flow rates
specified below were used to perform the experiment using a CM5
sensor chip in a Biacore T200 and may need to be adjusted to suit
other instruments. For the T200, follow the recommendations for
reagent volumes and tubes suggested by the software based on the
contact times and flow rates.
1. Make 500 μL of a 4-mg/mL solution of HEWL in SPR immobilization buffer. The solution should be filtered and degassed
under a weak vacuum for 3–5 min before use.
2. Run the Biacore desorption protocol to ensure that the instrument is clean at the start of the measurements. Mount a new
CM5 sensor chip and prime the instrument with immobilization buffer.
3. Expose two or more flow channels on the CM5 sensor chip
surface to a mixture of 0.4 M N-ethyl-N
0 -dimethylaminopropyl
carbodiimide (EDC) and 0.1 M N-hydroxysuccinimide (NHS)
for 7 min at a flow rate of 2 μL/min. This creates an activated
a
b
VP-ITC
ITC200
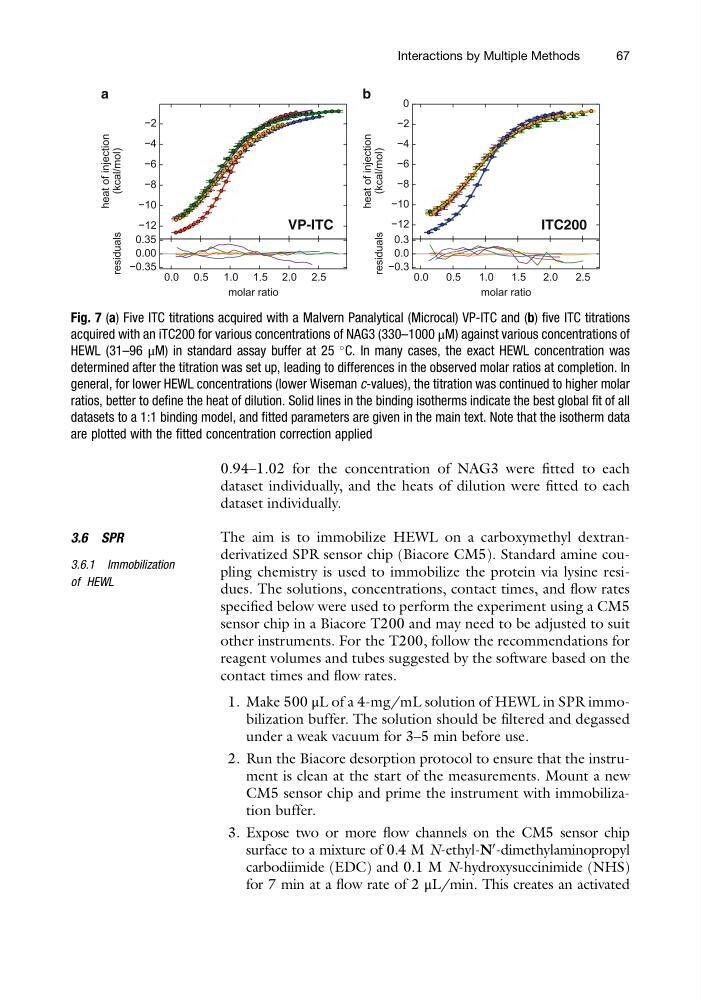
Fig. 7 (a) Five ITC titrations acquired with a Malvern Panalytical (Microcal) VP-ITC and (b) five ITC titrations
acquired with an iTC200 for various concentrations of NAG3 (330–1000 μM) against various concentrations of
HEWL (31–96 μM) in standard assay buffer at 25
C. In many cases, the exact HEWL concentration was
determined after the titration was set up, leading to differences in the observed molar ratios at completion. In
general, for lower HEWL concentrations (lower Wiseman c-values), the titration was continued to higher molar
ratios, better to define the heat of dilution. Solid lines in the binding isotherms indicate the best global fit of all
datasets to a 1:1 binding model, and fitted parameters are given in the main text. Note that the isotherm data
are plotted with the fitted concentration correction applied
Interactions by Multiple Methods
67
dataset individually, and the heats of dilution were fitted to each
dataset individually.
3.6 SPR
3.6.1 Immobilization
of HEWL
The aim is to immobilize HEWL on a carboxymethyl dextranderivatized SPR sensor chip (Biacore CM5). Standard amine coupling chemistry is used to immobilize the protein via lysine residues. The solutions, concentrations, contact times, and flow rates
specified below were used to perform the experiment using a CM5
sensor chip in a Biacore T200 and may need to be adjusted to suit
other instruments. For the T200, follow the recommendations for
reagent volumes and tubes suggested by the software based on the
contact times and flow rates.
1. Make 500 μL of a 4-mg/mL solution of HEWL in SPR immobilization buffer. The solution should be filtered and degassed
under a weak vacuum for 3–5 min before use.
2. Run the Biacore desorption protocol to ensure that the instrument is clean at the start of the measurements. Mount a new
CM5 sensor chip and prime the instrument with immobilization buffer.
3. Expose two or more flow channels on the CM5 sensor chip
surface to a mixture of 0.4 M N-ethyl-N
0 -dimethylaminopropyl
carbodiimide (EDC) and 0.1 M N-hydroxysuccinimide (NHS)
for 7 min at a flow rate of 2 μL/min. This creates an activated
a
b
VP-ITC
ITC200
Fig. 7 (a) Five ITC titrations acquired with a Malvern Panalytical (Microcal) VP-ITC and (b) five ITC titrations
acquired with an iTC200 for various concentrations of NAG3 (330–1000 μM) against various concentrations of
HEWL (31–96 μM) in standard assay buffer at 25
C. In many cases, the exact HEWL concentration was
determined after the titration was set up, leading to differences in the observed molar ratios at completion. In
general, for lower HEWL concentrations (lower Wiseman c-values), the titration was continued to higher molar
ratios, better to define the heat of dilution. Solid lines in the binding isotherms indicate the best global fit of all
datasets to a 1:1 binding model, and fitted parameters are given in the main text. Note that the isotherm data
are plotted with the fitted concentration correction applied
Interactions by Multiple Methods
67