

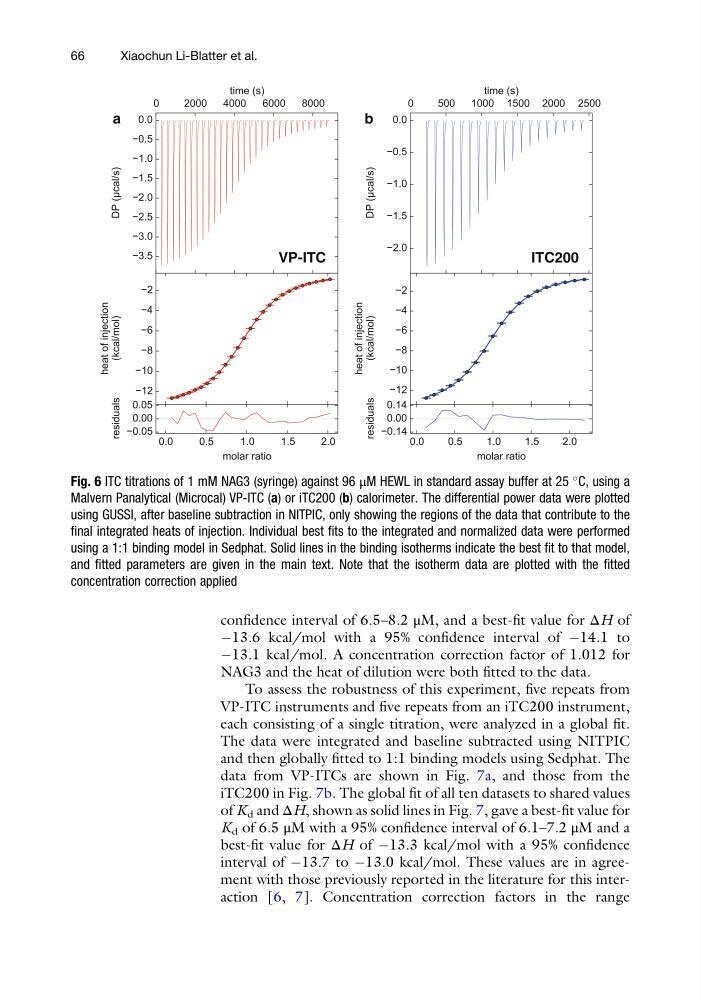
confidence interval of 6.5–8.2 μM, and a best-fit value for ΔH of
À13.6 kcal/mol with a 95% confidence interval of À14.1 to
À13.1 kcal/mol. A concentration correction factor of 1.012 for
NAG3 and the heat of dilution were both fitted to the data.
To assess the robustness of this experiment, five repeats from
VP-ITC instruments and five repeats from an iTC200 instrument,
each consisting of a single titration, were analyzed in a global fit.
The data were integrated and baseline subtracted using NITPIC
and then globally fitted to 1:1 binding models using Sedphat. The
data from VP-ITCs are shown in Fig. 7a, and those from the
iTC200 in Fig. 7b. The global fit of all ten datasets to shared values
of K d and ΔH, shown as solid lines in Fig. 7, gave a best-fit value for
K d of 6.5 μM with a 95% confidence interval of 6.1–7.2 μM and a
best-fit value for ΔH of À13.3 kcal/mol with a 95% confidence
interval of À13.7 to À13.0 kcal/mol. These values are in agreement with those previously reported in the literature for this interaction [6, 7]. Concentration correction factors in the range
a
b
VP-ITC
ITC200
Fig. 6 ITC titrations of 1 mM NAG3 (syringe) against 96 μM HEWL in standard assay buffer at 25
C, using a
Malvern Panalytical (Microcal) VP-ITC (a) or iTC200 (b) calorimeter. The differential power data were plotted
using GUSSI, after baseline subtraction in NITPIC, only showing the regions of the data that contribute to the
final integrated heats of injection. Individual best fits to the integrated and normalized data were performed
using a 1:1 binding model in Sedphat. Solid lines in the binding isotherms indicate the best fit to that model,
and fitted parameters are given in the main text. Note that the isotherm data are plotted with the fitted
concentration correction applied
66
Xiaochun Li-Blatter et al.
À13.6 kcal/mol with a 95% confidence interval of À14.1 to
À13.1 kcal/mol. A concentration correction factor of 1.012 for
NAG3 and the heat of dilution were both fitted to the data.
To assess the robustness of this experiment, five repeats from
VP-ITC instruments and five repeats from an iTC200 instrument,
each consisting of a single titration, were analyzed in a global fit.
The data were integrated and baseline subtracted using NITPIC
and then globally fitted to 1:1 binding models using Sedphat. The
data from VP-ITCs are shown in Fig. 7a, and those from the
iTC200 in Fig. 7b. The global fit of all ten datasets to shared values
of K d and ΔH, shown as solid lines in Fig. 7, gave a best-fit value for
K d of 6.5 μM with a 95% confidence interval of 6.1–7.2 μM and a
best-fit value for ΔH of À13.3 kcal/mol with a 95% confidence
interval of À13.7 to À13.0 kcal/mol. These values are in agreement with those previously reported in the literature for this interaction [6, 7]. Concentration correction factors in the range
a
b
VP-ITC
ITC200
Fig. 6 ITC titrations of 1 mM NAG3 (syringe) against 96 μM HEWL in standard assay buffer at 25
C, using a
Malvern Panalytical (Microcal) VP-ITC (a) or iTC200 (b) calorimeter. The differential power data were plotted
using GUSSI, after baseline subtraction in NITPIC, only showing the regions of the data that contribute to the
final integrated heats of injection. Individual best fits to the integrated and normalized data were performed
using a 1:1 binding model in Sedphat. Solid lines in the binding isotherms indicate the best fit to that model,
and fitted parameters are given in the main text. Note that the isotherm data are plotted with the fitted
concentration correction applied
66
Xiaochun Li-Blatter et al.