

windows of 3 s, centered at time points of 30 s (hot) and 2.5 s
(cold). Since the signal plateau amplitude decreases in the
presence of increasing NAG3 concentration, the per mille
ratio also decreases.
2. Plot F norm (‰) against the molar concentration of NAG3 and
fit the data to Eq. 1 (Subheading 3.3.3). This can be performed
either in the Nanotemper Analysis software (the equation used
is essentially identical to Eq. 1) or by exporting the F norm (‰)
data to any software capable of nonlinear regression.
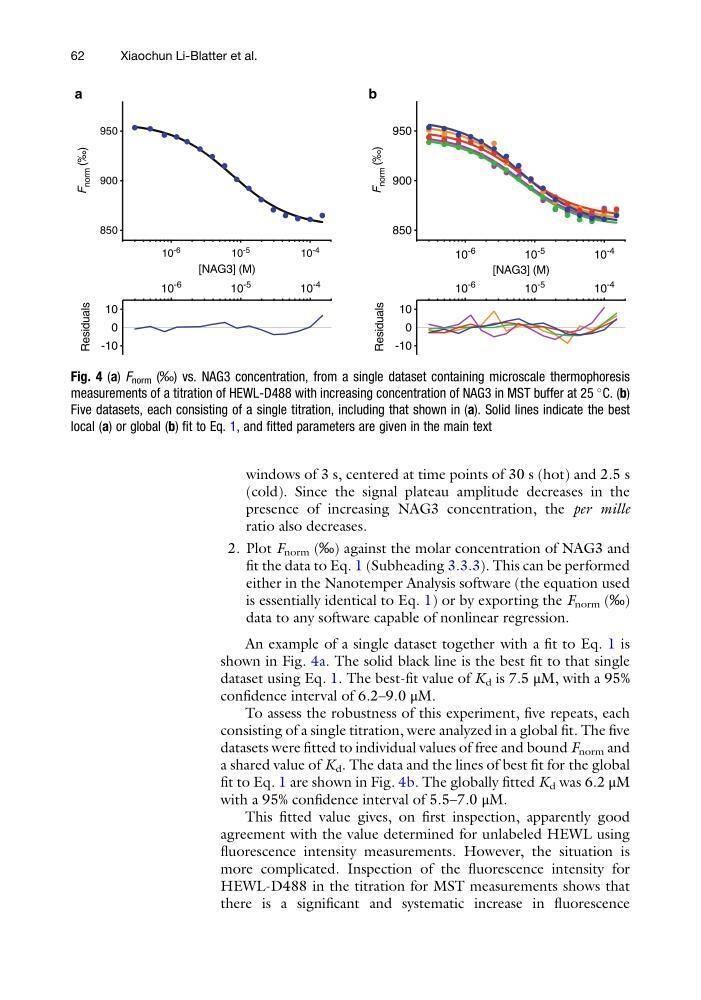
An example of a single dataset together with a fit to Eq. 1 is
shown in Fig. 4a. The solid black line is the best fit to that single
dataset using Eq. 1. The best-fit value of K d is 7.5 μM, with a 95%
confidence interval of 6.2–9.0 μM.
To assess the robustness of this experiment, five repeats, each
consisting of a single titration, were analyzed in a global fit. The five
datasets were fitted to individual values of free and bound F norm and
a shared value of K d . The data and the lines of best fit for the global
fit to Eq. 1 are shown in Fig. 4b. The globally fitted K d was 6.2 μM
with a 95% confidence interval of 5.5–7.0 μM.
This fitted value gives, on first inspection, apparently good
agreement with the value determined for unlabeled HEWL using
fluorescence intensity measurements. However, the situation is
more complicated. Inspection of the fluorescence intensity for
HEWL-D488 in the titration for MST measurements shows that
there is a significant and systematic increase in fluorescence
10 -6
10 -5
10 -4
850
900
950
[NAG3] (M)
F
norm
10
-6
10
-5
10
-4
-10
0
10
Residuals
10
-6
10
-5
10
-4
850
900
950
[NAG3] (M)
F
norm
10
-6
10
-5
10
-4
-10
0
10
Residuals
a
b
Fig. 4 (a) F norm (‰) vs. NAG3 concentration, from a single dataset containing microscale thermophoresis
measurements of a titration of HEWL-D488 with increasing concentration of NAG3 in MST buffer at 25
C. (b)
Five datasets, each consisting of a single titration, including that shown in (a). Solid lines indicate the best
local (a) or global (b) fit to Eq. 1, and fitted parameters are given in the main text
62
Xiaochun Li-Blatter et al.
(cold). Since the signal plateau amplitude decreases in the
presence of increasing NAG3 concentration, the per mille
ratio also decreases.
2. Plot F norm (‰) against the molar concentration of NAG3 and
fit the data to Eq. 1 (Subheading 3.3.3). This can be performed
either in the Nanotemper Analysis software (the equation used
is essentially identical to Eq. 1) or by exporting the F norm (‰)
data to any software capable of nonlinear regression.
An example of a single dataset together with a fit to Eq. 1 is
shown in Fig. 4a. The solid black line is the best fit to that single
dataset using Eq. 1. The best-fit value of K d is 7.5 μM, with a 95%
confidence interval of 6.2–9.0 μM.
To assess the robustness of this experiment, five repeats, each
consisting of a single titration, were analyzed in a global fit. The five
datasets were fitted to individual values of free and bound F norm and
a shared value of K d . The data and the lines of best fit for the global
fit to Eq. 1 are shown in Fig. 4b. The globally fitted K d was 6.2 μM
with a 95% confidence interval of 5.5–7.0 μM.
This fitted value gives, on first inspection, apparently good
agreement with the value determined for unlabeled HEWL using
fluorescence intensity measurements. However, the situation is
more complicated. Inspection of the fluorescence intensity for
HEWL-D488 in the titration for MST measurements shows that
there is a significant and systematic increase in fluorescence
10 -6
10 -5
10 -4
850
900
950
[NAG3] (M)
F
norm
10
-6
10
-5
10
-4
-10
0
10
Residuals
10
-6
10
-5
10
-4
850
900
950
[NAG3] (M)
F
norm
10
-6
10
-5
10
-4
-10
0
10
Residuals
a
b
Fig. 4 (a) F norm (‰) vs. NAG3 concentration, from a single dataset containing microscale thermophoresis
measurements of a titration of HEWL-D488 with increasing concentration of NAG3 in MST buffer at 25
C. (b)
Five datasets, each consisting of a single titration, including that shown in (a). Solid lines indicate the best
local (a) or global (b) fit to Eq. 1, and fitted parameters are given in the main text
62
Xiaochun Li-Blatter et al.