

3. Thaw out one or more aliquots of the HEWL-D488 and make
600 μL of a 300 nM solution in MST buffer.
4. Add 30 μL of this HEWL-D488 solution to the 30 μL of
NAG3 solution in each tube of the serial dilution and mix
well by pipetting (see Note 23).
5. Incubate the samples for 15 min at 25
C and then load them
into standard MST capillaries (see Note 24).
3.4.3 MST Measurement
1. Set the instrument temperature to 25
C and load the capillaries into the holder.
2. Use the blue channel excitation and detection with an LED
intensity of 40% (see Note 25).
3. Run the “find capillaries” routine and confirm that all capillaries exhibit fluorescence intensity between 200 and
1500 units, with minimal adsorption to the capillary surface
evinced by an approximately Gaussian distribution of intensity
across the capillary profile. If the fluorescence intensity lies
outside the desired range, adjust the LED intensity
accordingly.
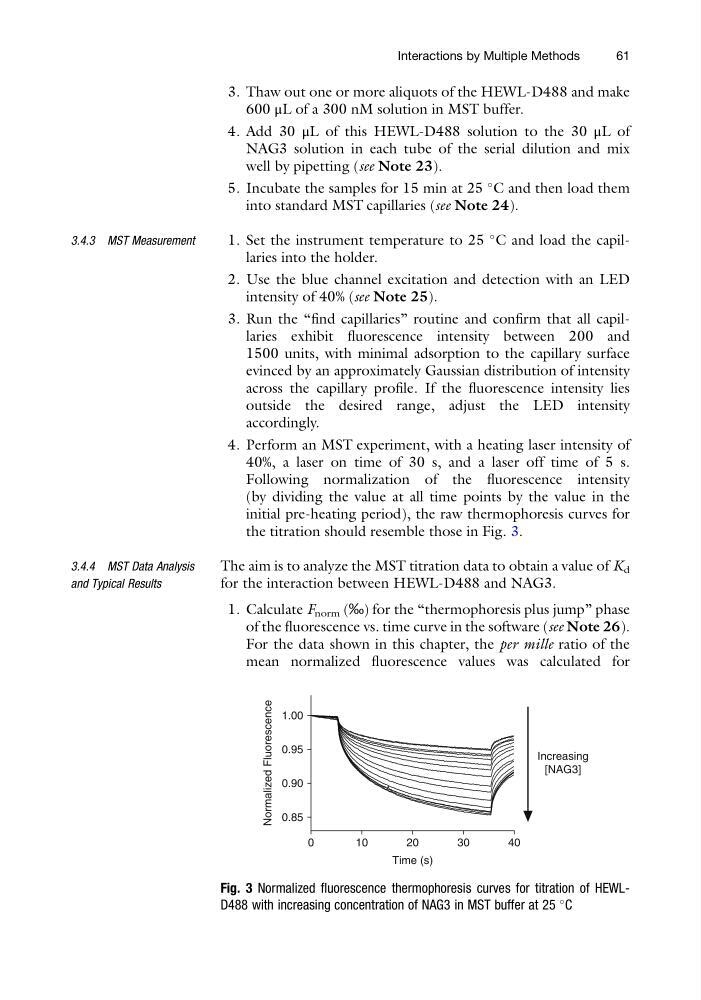
4. Perform an MST experiment, with a heating laser intensity of
40%, a laser on time of 30 s, and a laser off time of 5 s.
Following normalization of the fluorescence intensity
(by dividing the value at all time points by the value in the
initial pre-heating period), the raw thermophoresis curves for
the titration should resemble those in Fig. 3.
3.4.4 MST Data Analysis
and Typical Results
The aim is to analyze the MST titration data to obtain a value of K d
for the interaction between HEWL-D488 and NAG3.
1. Calculate F norm (‰) for the “thermophoresis plus jump” phase
of the fluorescence vs. time curve in the software (see Note 26).
For the data shown in this chapter, the per mille ratio of the
mean normalized fluorescence values was calculated for
0
1 0
2 0
3 0
4 0
0.85
0.90
0.95
1.00
Time (s)
Normalized Fluorescence
Increasing
[NAG3]
Fig. 3 Normalized fluorescence thermophoresis curves for titration of HEWLD488 with increasing concentration of NAG3 in MST buffer at 25
C
Interactions by Multiple Methods
61
600 μL of a 300 nM solution in MST buffer.
4. Add 30 μL of this HEWL-D488 solution to the 30 μL of
NAG3 solution in each tube of the serial dilution and mix
well by pipetting (see Note 23).
5. Incubate the samples for 15 min at 25
C and then load them
into standard MST capillaries (see Note 24).
3.4.3 MST Measurement
1. Set the instrument temperature to 25
C and load the capillaries into the holder.
2. Use the blue channel excitation and detection with an LED
intensity of 40% (see Note 25).
3. Run the “find capillaries” routine and confirm that all capillaries exhibit fluorescence intensity between 200 and
1500 units, with minimal adsorption to the capillary surface
evinced by an approximately Gaussian distribution of intensity
across the capillary profile. If the fluorescence intensity lies
outside the desired range, adjust the LED intensity
accordingly.
4. Perform an MST experiment, with a heating laser intensity of
40%, a laser on time of 30 s, and a laser off time of 5 s.
Following normalization of the fluorescence intensity
(by dividing the value at all time points by the value in the
initial pre-heating period), the raw thermophoresis curves for
the titration should resemble those in Fig. 3.
3.4.4 MST Data Analysis
and Typical Results
The aim is to analyze the MST titration data to obtain a value of K d
for the interaction between HEWL-D488 and NAG3.
1. Calculate F norm (‰) for the “thermophoresis plus jump” phase
of the fluorescence vs. time curve in the software (see Note 26).
For the data shown in this chapter, the per mille ratio of the
mean normalized fluorescence values was calculated for
0
1 0
2 0
3 0
4 0
0.85
0.90
0.95
1.00
Time (s)
Normalized Fluorescence
Increasing
[NAG3]
Fig. 3 Normalized fluorescence thermophoresis curves for titration of HEWLD488 with increasing concentration of NAG3 in MST buffer at 25
C
Interactions by Multiple Methods
61