

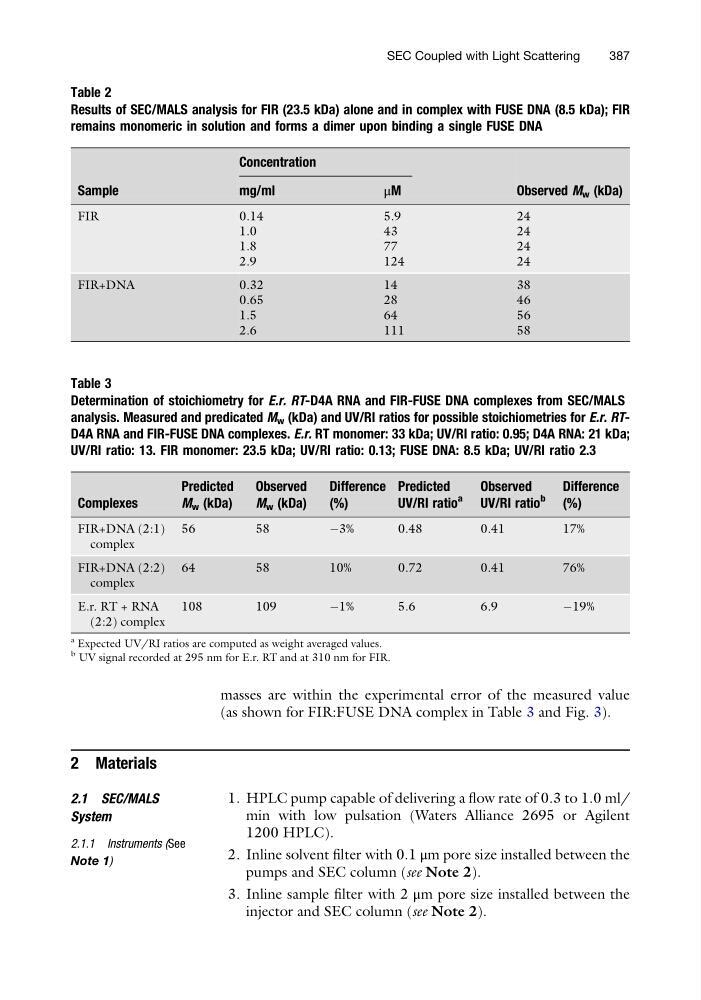
masses are within the experimental error of the measured value
(as shown for FIR:FUSE DNA complex in Table 3 and Fig. 3).
2 Materials
2.1 SEC/MALS
System
2.1.1 Instruments (See
Note 1)
1. HPLC pump capable of delivering a flow rate of 0.3 to 1.0 ml/
min with low pulsation (Waters Alliance 2695 or Agilent
1200 HPLC).
2. Inline solvent filter with 0.1 μm pore size installed between the
pumps and SEC column (see Note 2).
3. Inline sample filter with 2 μm pore size installed between the
injector and SEC column (see Note 2).
Table 2
Results of SEC/MALS analysis for FIR (23.5 kDa) alone and in complex with FUSE DNA (8.5 kDa); FIR
remains monomeric in solution and forms a dimer upon binding a single FUSE DNA
Sample
Concentration
Observed M w (kDa)
mg/ml
μM
FIR
0.14
5.9
24
1.0
43
24
1.8
77
24
2.9
124
24
FIR+DNA
0.32
14
38
0.65
28
46
1.5
64
56
2.6
111
58
Table 3
Determination of stoichiometry for E.r. RT-D4A RNA and FIR-FUSE DNA complexes from SEC/MALS
analysis. Measured and predicated M w (kDa) and UV/RI ratios for possible stoichiometries for E.r. RTD4A RNA and FIR-FUSE DNA complexes. E.r. RT monomer: 33 kDa; UV/RI ratio: 0.95; D4A RNA: 21 kDa;
UV/RI ratio: 13. FIR monomer: 23.5 kDa; UV/RI ratio: 0.13; FUSE DNA: 8.5 kDa; UV/RI ratio 2.3
Complexes
Predicted
M w (kDa)
Observed
M w (kDa)
Difference
(%)
Predicted
UV/RI ratio
a
Observed
UV/RI ratio
b
Difference
(%)
FIR+DNA (2:1)
complex
56
58
À3%
0.48
0.41
17%
FIR+DNA (2:2)
complex
64
58
10%
0.72
0.41
76%
E.r. RT + RNA
(2:2) complex
108
109
À1%
5.6
6.9
À19%
a Expected UV/RI ratios are computed as weight averaged values.
b UV signal recorded at 295 nm for E.r. RT and at 310 nm for FIR.
SEC Coupled with Light Scattering
387
(as shown for FIR:FUSE DNA complex in Table 3 and Fig. 3).
2 Materials
2.1 SEC/MALS
System
2.1.1 Instruments (See
Note 1)
1. HPLC pump capable of delivering a flow rate of 0.3 to 1.0 ml/
min with low pulsation (Waters Alliance 2695 or Agilent
1200 HPLC).
2. Inline solvent filter with 0.1 μm pore size installed between the
pumps and SEC column (see Note 2).
3. Inline sample filter with 2 μm pore size installed between the
injector and SEC column (see Note 2).
Table 2
Results of SEC/MALS analysis for FIR (23.5 kDa) alone and in complex with FUSE DNA (8.5 kDa); FIR
remains monomeric in solution and forms a dimer upon binding a single FUSE DNA
Sample
Concentration
Observed M w (kDa)
mg/ml
μM
FIR
0.14
5.9
24
1.0
43
24
1.8
77
24
2.9
124
24
FIR+DNA
0.32
14
38
0.65
28
46
1.5
64
56
2.6
111
58
Table 3
Determination of stoichiometry for E.r. RT-D4A RNA and FIR-FUSE DNA complexes from SEC/MALS
analysis. Measured and predicated M w (kDa) and UV/RI ratios for possible stoichiometries for E.r. RTD4A RNA and FIR-FUSE DNA complexes. E.r. RT monomer: 33 kDa; UV/RI ratio: 0.95; D4A RNA: 21 kDa;
UV/RI ratio: 13. FIR monomer: 23.5 kDa; UV/RI ratio: 0.13; FUSE DNA: 8.5 kDa; UV/RI ratio 2.3
Complexes
Predicted
M w (kDa)
Observed
M w (kDa)
Difference
(%)
Predicted
UV/RI ratio
a
Observed
UV/RI ratio
b
Difference
(%)
FIR+DNA (2:1)
complex
56
58
À3%
0.48
0.41
17%
FIR+DNA (2:2)
complex
64
58
10%
0.72
0.41
76%
E.r. RT + RNA
(2:2) complex
108
109
À1%
5.6
6.9
À19%
a Expected UV/RI ratios are computed as weight averaged values.
b UV signal recorded at 295 nm for E.r. RT and at 310 nm for FIR.
SEC Coupled with Light Scattering
387