

due to their elongated shape; the 58 kDa complex of FIR:FUSE
DNA elutes ahead of 66 kDa globular standard (Fig. 2b), and
110 kDa complex of E.r. RT:D4A RNA elutes ahead of 156 kDa
aldolase (Fig. 1b). The signals recorded by the UV detector and
refractometer are also used to discriminate between two possible
protein–nucleic acid stoichiometries, for which the predicated
FIR+DNA complex measured Mw (kDa)
20
40
60
80
100
120
Experimental UV/RI ratio
0.0
0.5
1.0
1.5
2.0
2.5
DNA alone
FIR alone
FIR:DNA 2:1
FIR:DNA 2:2
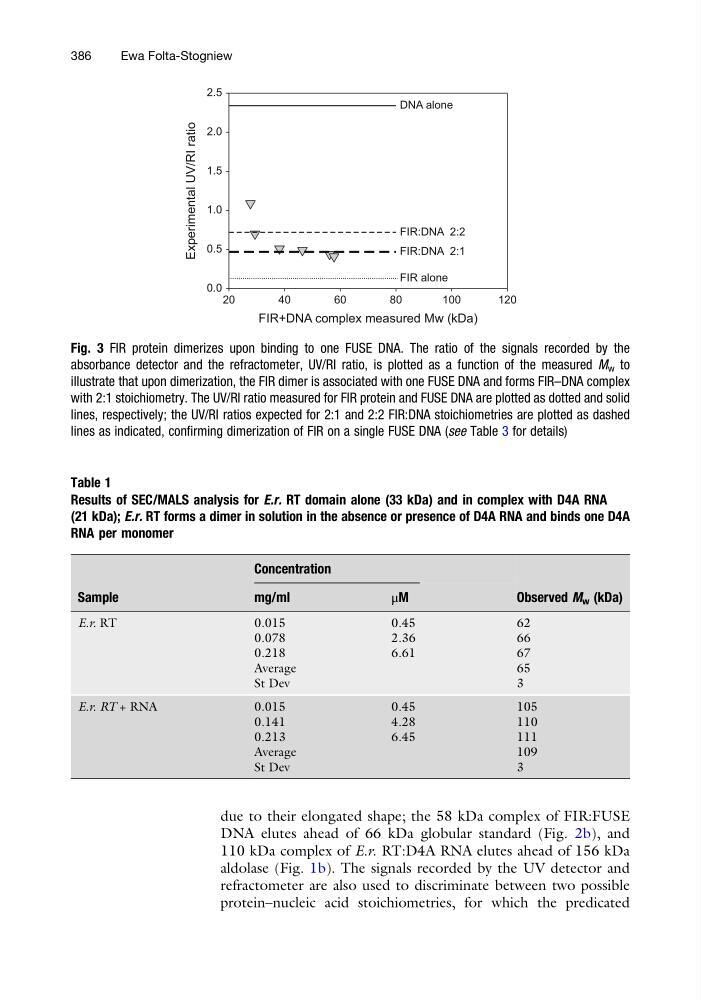
Fig. 3 FIR protein dimerizes upon binding to one FUSE DNA. The ratio of the signals recorded by the
absorbance detector and the refractometer, UV/RI ratio, is plotted as a function of the measured M w to
illustrate that upon dimerization, the FIR dimer is associated with one FUSE DNA and forms FIR–DNA complex
with 2:1 stoichiometry. The UV/RI ratio measured for FIR protein and FUSE DNA are plotted as dotted and solid
lines, respectively; the UV/RI ratios expected for 2:1 and 2:2 FIR:DNA stoichiometries are plotted as dashed
lines as indicated, confirming dimerization of FIR on a single FUSE DNA (see Table 3 for details)
Table 1
Results of SEC/MALS analysis for E.r. RT domain alone (33 kDa) and in complex with D4A RNA
(21 kDa); E.r. RT forms a dimer in solution in the absence or presence of D4A RNA and binds one D4A
RNA per monomer
Sample
Concentration
Observed M w (kDa)
mg/ml
μM
E.r. RT
0.015
0.45
62
0.078
2.36
66
0.218
6.61
67
Average
65
St Dev
3
E.r. RT + RNA
0.015
0.45
105
0.141
4.28
110
0.213
6.45
111
Average
109
St Dev
3
386
Ewa Folta-Stogniew
DNA elutes ahead of 66 kDa globular standard (Fig. 2b), and
110 kDa complex of E.r. RT:D4A RNA elutes ahead of 156 kDa
aldolase (Fig. 1b). The signals recorded by the UV detector and
refractometer are also used to discriminate between two possible
protein–nucleic acid stoichiometries, for which the predicated
FIR+DNA complex measured Mw (kDa)
20
40
60
80
100
120
Experimental UV/RI ratio
0.0
0.5
1.0
1.5
2.0
2.5
DNA alone
FIR alone
FIR:DNA 2:1
FIR:DNA 2:2
Fig. 3 FIR protein dimerizes upon binding to one FUSE DNA. The ratio of the signals recorded by the
absorbance detector and the refractometer, UV/RI ratio, is plotted as a function of the measured M w to
illustrate that upon dimerization, the FIR dimer is associated with one FUSE DNA and forms FIR–DNA complex
with 2:1 stoichiometry. The UV/RI ratio measured for FIR protein and FUSE DNA are plotted as dotted and solid
lines, respectively; the UV/RI ratios expected for 2:1 and 2:2 FIR:DNA stoichiometries are plotted as dashed
lines as indicated, confirming dimerization of FIR on a single FUSE DNA (see Table 3 for details)
Table 1
Results of SEC/MALS analysis for E.r. RT domain alone (33 kDa) and in complex with D4A RNA
(21 kDa); E.r. RT forms a dimer in solution in the absence or presence of D4A RNA and binds one D4A
RNA per monomer
Sample
Concentration
Observed M w (kDa)
mg/ml
μM
E.r. RT
0.015
0.45
62
0.078
2.36
66
0.218
6.61
67
Average
65
St Dev
3
E.r. RT + RNA
0.015
0.45
105
0.141
4.28
110
0.213
6.45
111
Average
109
St Dev
3
386
Ewa Folta-Stogniew