

Elution volume (ml)
12
13
14
15
0.0
0.5
1.0
1.5
0
20
40
60
80
2.6 mg/ml
1.5 mg/ml
0.7 mg/ml
0.3 mg/ml
2.6 mg/ml
1.5 mg/ml
0.7 mg/ml
0.3 mg/ml
66
43 kDa
Elution volume (ml)
15
16
17
18
19
0.0
0.5
1.0
a
b
c
0
10
20
30
0.14 mg/ml
1.2 mg/ml
2.3 mg/ml
0.14 mg/ml
1.2 mg/ml
2.3 mg/ml
Abs 295 nm
Abs 310 nm
Mw (kDa)
Mw (kDa)
[FIR] (mM)
0
3 0
6 0
9 0
1 2 0
1 5 0
M
w (kDa)
15
35
55
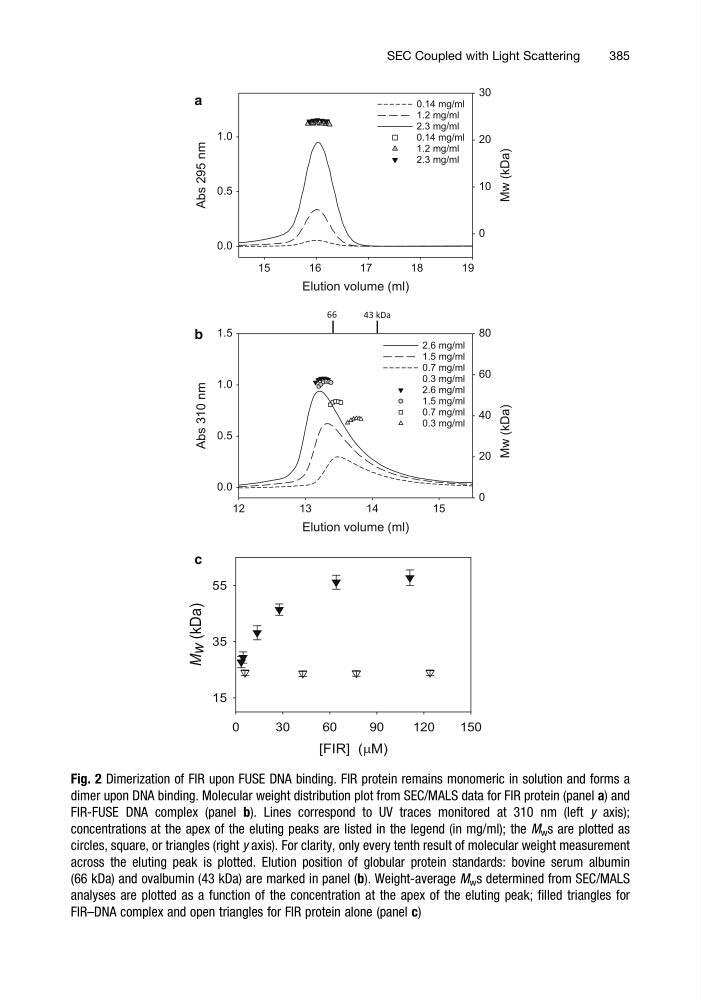
Fig. 2 Dimerization of FIR upon FUSE DNA binding. FIR protein remains monomeric in solution and forms a
dimer upon DNA binding. Molecular weight distribution plot from SEC/MALS data for FIR protein (panel a) and
FIR-FUSE DNA complex (panel b). Lines correspond to UV traces monitored at 310 nm (left y axis);
concentrations at the apex of the eluting peaks are listed in the legend (in mg/ml); the M w s are plotted as
circles, square, or triangles (right y axis). For clarity, only every tenth result of molecular weight measurement
across the eluting peak is plotted. Elution position of globular protein standards: bovine serum albumin
(66 kDa) and ovalbumin (43 kDa) are marked in panel (b). Weight-average M w s determined from SEC/MALS
analyses are plotted as a function of the concentration at the apex of the eluting peak; filled triangles for
FIR–DNA complex and open triangles for FIR protein alone (panel c)
SEC Coupled with Light Scattering
385
12
13
14
15
0.0
0.5
1.0
1.5
0
20
40
60
80
2.6 mg/ml
1.5 mg/ml
0.7 mg/ml
0.3 mg/ml
2.6 mg/ml
1.5 mg/ml
0.7 mg/ml
0.3 mg/ml
66
43 kDa
Elution volume (ml)
15
16
17
18
19
0.0
0.5
1.0
a
b
c
0
10
20
30
0.14 mg/ml
1.2 mg/ml
2.3 mg/ml
0.14 mg/ml
1.2 mg/ml
2.3 mg/ml
Abs 295 nm
Abs 310 nm
Mw (kDa)
Mw (kDa)
[FIR] (mM)
0
3 0
6 0
9 0
1 2 0
1 5 0
M
w (kDa)
15
35
55
Fig. 2 Dimerization of FIR upon FUSE DNA binding. FIR protein remains monomeric in solution and forms a
dimer upon DNA binding. Molecular weight distribution plot from SEC/MALS data for FIR protein (panel a) and
FIR-FUSE DNA complex (panel b). Lines correspond to UV traces monitored at 310 nm (left y axis);
concentrations at the apex of the eluting peaks are listed in the legend (in mg/ml); the M w s are plotted as
circles, square, or triangles (right y axis). For clarity, only every tenth result of molecular weight measurement
across the eluting peak is plotted. Elution position of globular protein standards: bovine serum albumin
(66 kDa) and ovalbumin (43 kDa) are marked in panel (b). Weight-average M w s determined from SEC/MALS
analyses are plotted as a function of the concentration at the apex of the eluting peak; filled triangles for
FIR–DNA complex and open triangles for FIR protein alone (panel c)
SEC Coupled with Light Scattering
385