

Time (s)
P i free k +2 , k +3 = 1, 3 s
-1 or 3, 1 s
-1
P i total k +2 = 3 s
-1
P i total k +2 = 1 s
-1
P i free k +2 , k +3 = 1, 100 s
-1 or 100, 1 s
-1
P i total k +2 = 100 s
-1
P i total k +2 = 1 s
-1
0.0
0
1
2
3
4
5
0
1
2
3
4
5
0.5
1.0
0.0
0.5
1.0
Time (s)
[P
i ] (µM)
[P
i ] (µM)
a
b
0
1
2
3
0
1
2
3
Time (s)
[P
i ]
free / [Enzyme]
burst
steady-state
lag
k +2 k +3 k +4 (s
-1 )
3
100
1
0.78 100 100
3
1
100
c
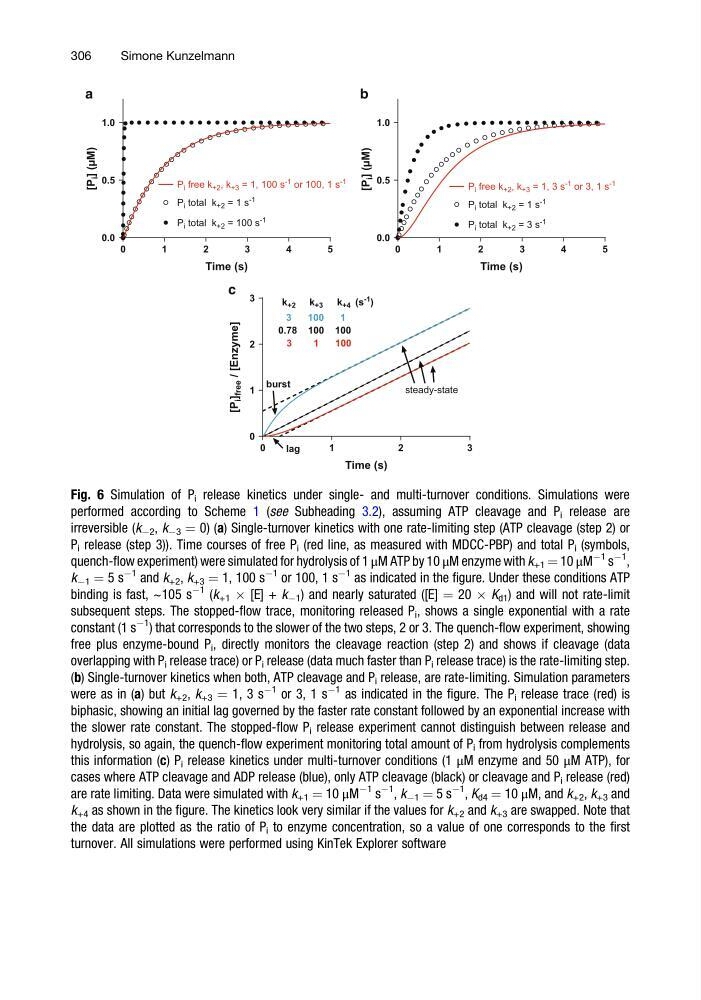
Fig. 6 Simulation of P i release kinetics under single- and multi-turnover conditions. Simulations were
performed according to Scheme 1 (see Subheading 3.2), assuming ATP cleavage and P i release are
irreversible (k À2 , k À3 ¼ 0) (a) Single-turnover kinetics with one rate-limiting step (ATP cleavage (step 2) or
P i release (step 3)). Time courses of free P i (red line, as measured with MDCC-PBP) and total P i (symbols,
quench-flow experiment) were simulated for hydrolysis of 1 μM ATP by 10 μM enzyme with k +1 ¼ 10 μM
À1
s
À1
,
k À1 ¼ 5 s
À1
and k +2 , k +3 ¼ 1, 100 s
À1
or 100, 1 s
À1
as indicated in the figure. Under these conditions ATP
binding is fast, ~105 s
À1
(k +1 Â [E] + k À1 ) and nearly saturated ([E] ¼ 20 Â K d1 ) and will not rate-limit
subsequent steps. The stopped-flow trace, monitoring released P i , shows a single exponential with a rate
constant (1 s
À1
) that corresponds to the slower of the two steps, 2 or 3. The quench-flow experiment, showing
free plus enzyme-bound P i , directly monitors the cleavage reaction (step 2) and shows if cleavage (data
overlapping with P i release trace) or P i release (data much faster than P i release trace) is the rate-limiting step.
(b) Single-turnover kinetics when both, ATP cleavage and P i release, are rate-limiting. Simulation parameters
were as in (a) but k +2 , k +3 ¼ 1, 3 s
À1
or 3, 1 s
À1
as indicated in the figure. The P i release trace (red) is
biphasic, showing an initial lag governed by the faster rate constant followed by an exponential increase with
the slower rate constant. The stopped-flow P i release experiment cannot distinguish between release and
hydrolysis, so again, the quench-flow experiment monitoring total amount of P i from hydrolysis complements
this information (c) P i release kinetics under multi-turnover conditions (1 μM enzyme and 50 μM ATP), for
cases where ATP cleavage and ADP release (blue), only ATP cleavage (black) or cleavage and P i release (red)
are rate limiting. Data were simulated with k +1 ¼ 10 μM
À1
s
À1
, k À1 ¼ 5 s
À1
, K d4 ¼ 10 μM, and k +2 , k +3 and
k +4 as shown in the figure. The kinetics look very similar if the values for k +2 and k +3 are swapped. Note that
the data are plotted as the ratio of P i to enzyme concentration, so a value of one corresponds to the first
turnover. All simulations were performed using KinTek Explorer software
306
Simone Kunzelmann
P i free k +2 , k +3 = 1, 3 s
-1 or 3, 1 s
-1
P i total k +2 = 3 s
-1
P i total k +2 = 1 s
-1
P i free k +2 , k +3 = 1, 100 s
-1 or 100, 1 s
-1
P i total k +2 = 100 s
-1
P i total k +2 = 1 s
-1
0.0
0
1
2
3
4
5
0
1
2
3
4
5
0.5
1.0
0.0
0.5
1.0
Time (s)
[P
i ] (µM)
[P
i ] (µM)
a
b
0
1
2
3
0
1
2
3
Time (s)
[P
i ]
free / [Enzyme]
burst
steady-state
lag
k +2 k +3 k +4 (s
-1 )
3
100
1
0.78 100 100
3
1
100
c
Fig. 6 Simulation of P i release kinetics under single- and multi-turnover conditions. Simulations were
performed according to Scheme 1 (see Subheading 3.2), assuming ATP cleavage and P i release are
irreversible (k À2 , k À3 ¼ 0) (a) Single-turnover kinetics with one rate-limiting step (ATP cleavage (step 2) or
P i release (step 3)). Time courses of free P i (red line, as measured with MDCC-PBP) and total P i (symbols,
quench-flow experiment) were simulated for hydrolysis of 1 μM ATP by 10 μM enzyme with k +1 ¼ 10 μM
À1
s
À1
,
k À1 ¼ 5 s
À1
and k +2 , k +3 ¼ 1, 100 s
À1
or 100, 1 s
À1
as indicated in the figure. Under these conditions ATP
binding is fast, ~105 s
À1
(k +1 Â [E] + k À1 ) and nearly saturated ([E] ¼ 20 Â K d1 ) and will not rate-limit
subsequent steps. The stopped-flow trace, monitoring released P i , shows a single exponential with a rate
constant (1 s
À1
) that corresponds to the slower of the two steps, 2 or 3. The quench-flow experiment, showing
free plus enzyme-bound P i , directly monitors the cleavage reaction (step 2) and shows if cleavage (data
overlapping with P i release trace) or P i release (data much faster than P i release trace) is the rate-limiting step.
(b) Single-turnover kinetics when both, ATP cleavage and P i release, are rate-limiting. Simulation parameters
were as in (a) but k +2 , k +3 ¼ 1, 3 s
À1
or 3, 1 s
À1
as indicated in the figure. The P i release trace (red) is
biphasic, showing an initial lag governed by the faster rate constant followed by an exponential increase with
the slower rate constant. The stopped-flow P i release experiment cannot distinguish between release and
hydrolysis, so again, the quench-flow experiment monitoring total amount of P i from hydrolysis complements
this information (c) P i release kinetics under multi-turnover conditions (1 μM enzyme and 50 μM ATP), for
cases where ATP cleavage and ADP release (blue), only ATP cleavage (black) or cleavage and P i release (red)
are rate limiting. Data were simulated with k +1 ¼ 10 μM
À1
s
À1
, k À1 ¼ 5 s
À1
, K d4 ¼ 10 μM, and k +2 , k +3 and
k +4 as shown in the figure. The kinetics look very similar if the values for k +2 and k +3 are swapped. Note that
the data are plotted as the ratio of P i to enzyme concentration, so a value of one corresponds to the first
turnover. All simulations were performed using KinTek Explorer software
306
Simone Kunzelmann