

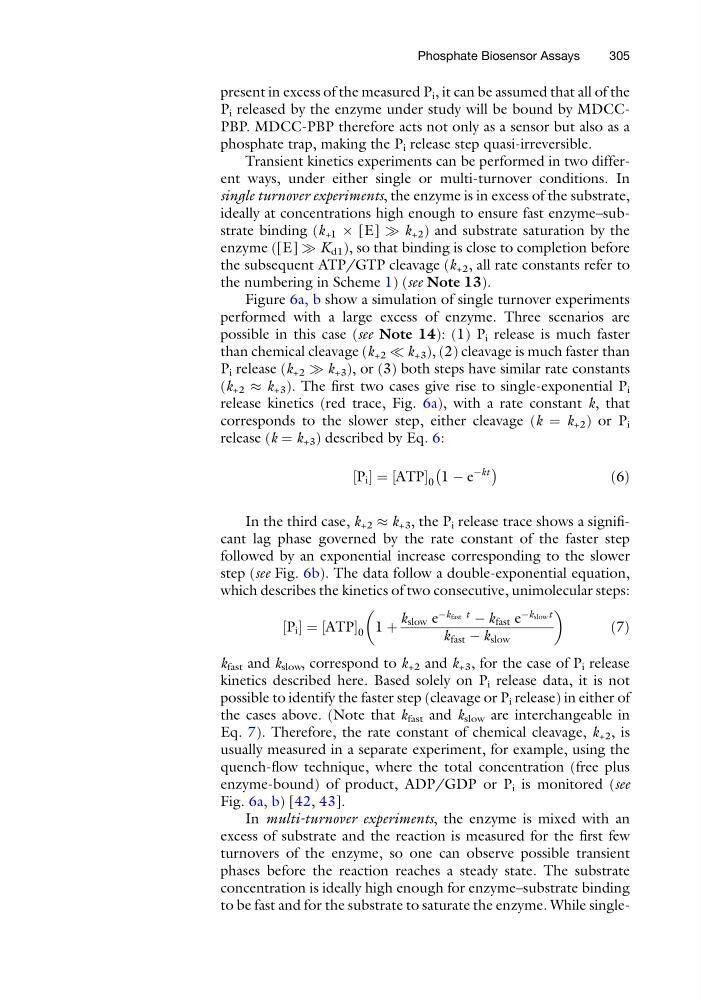
present in excess of the measured P i , it can be assumed that all of the
P i released by the enzyme under study will be bound by MDCCPBP. MDCC-PBP therefore acts not only as a sensor but also as a
phosphate trap, making the P i release step quasi-irreversible.
Transient kinetics experiments can be performed in two different ways, under either single or multi-turnover conditions. In
single turnover experiments, the enzyme is in excess of the substrate,
ideally at concentrations high enough to ensure fast enzyme–substrate binding (k +1 Â [E] ) k +2 ) and substrate saturation by the
enzyme ([E] ) K d1 ), so that binding is close to completion before
the subsequent ATP/GTP cleavage (k +2 , all rate constants refer to
the numbering in Scheme 1) (see Note 13).
Figure 6a, b show a simulation of single turnover experiments
performed with a large excess of enzyme. Three scenarios are
possible in this case (see Note 14): (1) P i release is much faster
than chemical cleavage (k +2 ( k +3 ), (2) cleavage is much faster than
P i release (k +2 ) k +3 ), or (3) both steps have similar rate constants
(k +2 % k +3 ). The first two cases give rise to single-exponential P i
release kinetics (red trace, Fig. 6a), with a rate constant k, that
corresponds to the slower step, either cleavage (k ¼ k +2 ) or P i
release (k ¼ k +3 ) described by Eq. 6:
P i
½ ¼ ATP
½
0 1 À e
Àkt
À
Á
ð6Þ
In the third case, k +2 % k +3 , the P i release trace shows a significant lag phase governed by the rate constant of the faster step
followed by an exponential increase corresponding to the slower
step (see Fig. 6b). The data follow a double-exponential equation,
which describes the kinetics of two consecutive, unimolecular steps:
P i
½ ¼ ATP
½
0 1 þ
k slow e
Àk fast t
À k fast e
Àk slow t
k fast À k slow
ð7Þ
k fast and k slow , correspond to k +2 and k +3 , for the case of P i release
kinetics described here. Based solely on P i release data, it is not
possible to identify the faster step (cleavage or P i release) in either of
the cases above. (Note that k fast and k slow are interchangeable in
Eq. 7). Therefore, the rate constant of chemical cleavage, k +2 , is
usually measured in a separate experiment, for example, using the
quench-flow technique, where the total concentration (free plus
enzyme-bound) of product, ADP/GDP or P i is monitored (see
Fig. 6a, b) [42, 43].
In multi-turnover experiments, the enzyme is mixed with an
excess of substrate and the reaction is measured for the first few
turnovers of the enzyme, so one can observe possible transient
phases before the reaction reaches a steady state. The substrate
concentration is ideally high enough for enzyme–substrate binding
to be fast and for the substrate to saturate the enzyme. While singlePhosphate Biosensor Assays
305
P i released by the enzyme under study will be bound by MDCCPBP. MDCC-PBP therefore acts not only as a sensor but also as a
phosphate trap, making the P i release step quasi-irreversible.
Transient kinetics experiments can be performed in two different ways, under either single or multi-turnover conditions. In
single turnover experiments, the enzyme is in excess of the substrate,
ideally at concentrations high enough to ensure fast enzyme–substrate binding (k +1 Â [E] ) k +2 ) and substrate saturation by the
enzyme ([E] ) K d1 ), so that binding is close to completion before
the subsequent ATP/GTP cleavage (k +2 , all rate constants refer to
the numbering in Scheme 1) (see Note 13).
Figure 6a, b show a simulation of single turnover experiments
performed with a large excess of enzyme. Three scenarios are
possible in this case (see Note 14): (1) P i release is much faster
than chemical cleavage (k +2 ( k +3 ), (2) cleavage is much faster than
P i release (k +2 ) k +3 ), or (3) both steps have similar rate constants
(k +2 % k +3 ). The first two cases give rise to single-exponential P i
release kinetics (red trace, Fig. 6a), with a rate constant k, that
corresponds to the slower step, either cleavage (k ¼ k +2 ) or P i
release (k ¼ k +3 ) described by Eq. 6:
P i
½ ¼ ATP
½
0 1 À e
Àkt
À
Á
ð6Þ
In the third case, k +2 % k +3 , the P i release trace shows a significant lag phase governed by the rate constant of the faster step
followed by an exponential increase corresponding to the slower
step (see Fig. 6b). The data follow a double-exponential equation,
which describes the kinetics of two consecutive, unimolecular steps:
P i
½ ¼ ATP
½
0 1 þ
k slow e
Àk fast t
À k fast e
Àk slow t
k fast À k slow
ð7Þ
k fast and k slow , correspond to k +2 and k +3 , for the case of P i release
kinetics described here. Based solely on P i release data, it is not
possible to identify the faster step (cleavage or P i release) in either of
the cases above. (Note that k fast and k slow are interchangeable in
Eq. 7). Therefore, the rate constant of chemical cleavage, k +2 , is
usually measured in a separate experiment, for example, using the
quench-flow technique, where the total concentration (free plus
enzyme-bound) of product, ADP/GDP or P i is monitored (see
Fig. 6a, b) [42, 43].
In multi-turnover experiments, the enzyme is mixed with an
excess of substrate and the reaction is measured for the first few
turnovers of the enzyme, so one can observe possible transient
phases before the reaction reaches a steady state. The substrate
concentration is ideally high enough for enzyme–substrate binding
to be fast and for the substrate to saturate the enzyme. While singlePhosphate Biosensor Assays
305