

turnover experiments only provide information about the steps
preceding the formation of the species being detected (in this case
all steps prior to and including release of free P i , step 3) multiturnover kinetics can also give insight into the succeeding steps
(in this case ADP release, step 4). For example, a reduction of the
reaction rate after the first turnover (burst kinetics) indicates that
there is a slow, rate-limiting step following the measured intermediate state (see Fig. 6c, blue line).
Figure 6c displays simulated data for three different scenarios in
a multi-turnover experiment. In the first case, there is only one ratelimiting step, either ATP cleavage (step 2) or P i release (step 3),
and the other steps, steps 3 or 2 and ADP release (step 4), are fast.
P i release data then show an approximately linear increase without a
detectable, initial transient phase (see Fig. 6c, black line). The slope
is the steady state rate constant, k ss , which corresponds to the
specific rate, ν, in steady state experiments (see Eq. 2), and, under
conditions of saturating substrate concentrations, to k cat . In the
second case, if a step following P i release is also rate-limiting, e.g.,
ADP dissociation (step 4), a transient burst in P i concentration is
observed, as described above (blue line in Fig. 6c). In case a ratelimiting step precedes P i release (steps 1 or 2), data are characterized by a lag before reaching steady state (red line in Fig. 6c). This
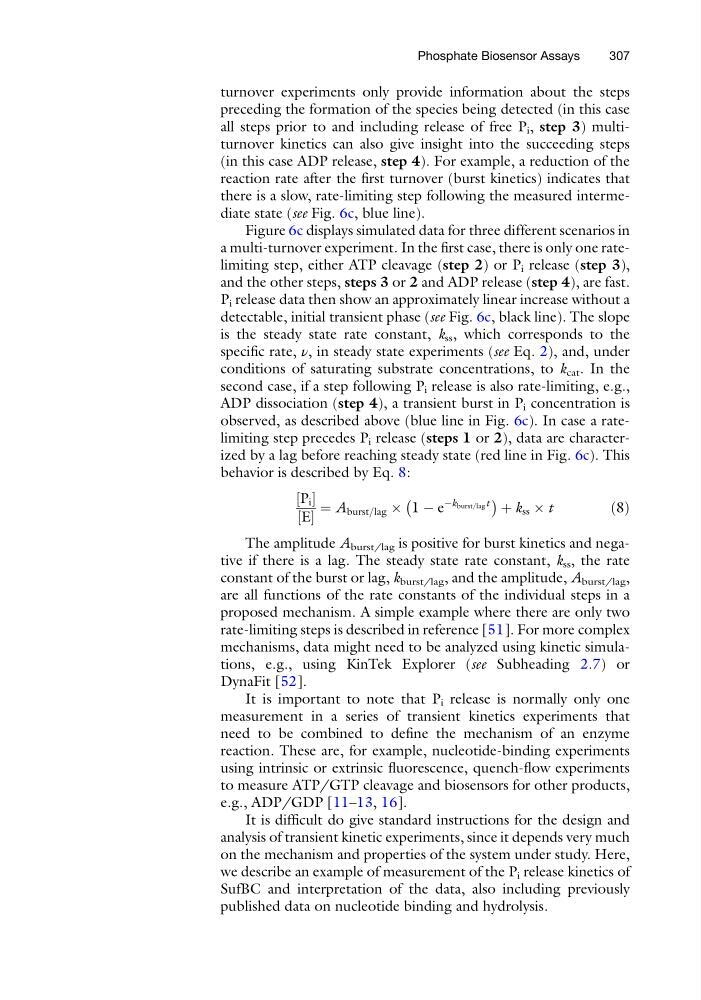
behavior is described by Eq. 8:
P i
½
E
½
¼ A burst=lag  1 À e
Àk burst=lag t
À
Á þ k ss  t
ð8Þ
The amplitude A burst/lag is positive for burst kinetics and negative if there is a lag. The steady state rate constant, k ss , the rate
constant of the burst or lag, k burst/lag , and the amplitude, A burst/lag ,
are all functions of the rate constants of the individual steps in a
proposed mechanism. A simple example where there are only two
rate-limiting steps is described in reference [51]. For more complex
mechanisms, data might need to be analyzed using kinetic simulations, e.g., using KinTek Explorer (see Subheading 2.7) or
DynaFit [52].
It is important to note that P i release is normally only one
measurement in a series of transient kinetics experiments that
need to be combined to define the mechanism of an enzyme
reaction. These are, for example, nucleotide-binding experiments
using intrinsic or extrinsic fluorescence, quench-flow experiments
to measure ATP/GTP cleavage and biosensors for other products,
e.g., ADP/GDP [11–13, 16].
It is difficult do give standard instructions for the design and
analysis of transient kinetic experiments, since it depends very much
on the mechanism and properties of the system under study. Here,
we describe an example of measurement of the P i release kinetics of
SufBC and interpretation of the data, also including previously
published data on nucleotide binding and hydrolysis.
Phosphate Biosensor Assays
307
preceding the formation of the species being detected (in this case
all steps prior to and including release of free P i , step 3) multiturnover kinetics can also give insight into the succeeding steps
(in this case ADP release, step 4). For example, a reduction of the
reaction rate after the first turnover (burst kinetics) indicates that
there is a slow, rate-limiting step following the measured intermediate state (see Fig. 6c, blue line).
Figure 6c displays simulated data for three different scenarios in
a multi-turnover experiment. In the first case, there is only one ratelimiting step, either ATP cleavage (step 2) or P i release (step 3),
and the other steps, steps 3 or 2 and ADP release (step 4), are fast.
P i release data then show an approximately linear increase without a
detectable, initial transient phase (see Fig. 6c, black line). The slope
is the steady state rate constant, k ss , which corresponds to the
specific rate, ν, in steady state experiments (see Eq. 2), and, under
conditions of saturating substrate concentrations, to k cat . In the
second case, if a step following P i release is also rate-limiting, e.g.,
ADP dissociation (step 4), a transient burst in P i concentration is
observed, as described above (blue line in Fig. 6c). In case a ratelimiting step precedes P i release (steps 1 or 2), data are characterized by a lag before reaching steady state (red line in Fig. 6c). This
behavior is described by Eq. 8:
P i
½
E
½
¼ A burst=lag  1 À e
Àk burst=lag t
À
Á þ k ss  t
ð8Þ
The amplitude A burst/lag is positive for burst kinetics and negative if there is a lag. The steady state rate constant, k ss , the rate
constant of the burst or lag, k burst/lag , and the amplitude, A burst/lag ,
are all functions of the rate constants of the individual steps in a
proposed mechanism. A simple example where there are only two
rate-limiting steps is described in reference [51]. For more complex
mechanisms, data might need to be analyzed using kinetic simulations, e.g., using KinTek Explorer (see Subheading 2.7) or
DynaFit [52].
It is important to note that P i release is normally only one
measurement in a series of transient kinetics experiments that
need to be combined to define the mechanism of an enzyme
reaction. These are, for example, nucleotide-binding experiments
using intrinsic or extrinsic fluorescence, quench-flow experiments
to measure ATP/GTP cleavage and biosensors for other products,
e.g., ADP/GDP [11–13, 16].
It is difficult do give standard instructions for the design and
analysis of transient kinetic experiments, since it depends very much
on the mechanism and properties of the system under study. Here,
we describe an example of measurement of the P i release kinetics of
SufBC and interpretation of the data, also including previously
published data on nucleotide binding and hydrolysis.
Phosphate Biosensor Assays
307