

3.1.2 Experimental
Design and Optimization
Biosensor Concentration
To determine the concentration of MDCC-PBP required, one
must consider the amount of P i to be measured and the amount
of P i contamination in the reagents. Generally, between 10 and
20 μM MDCC-PBP is appropriate, allowing detection of P i with
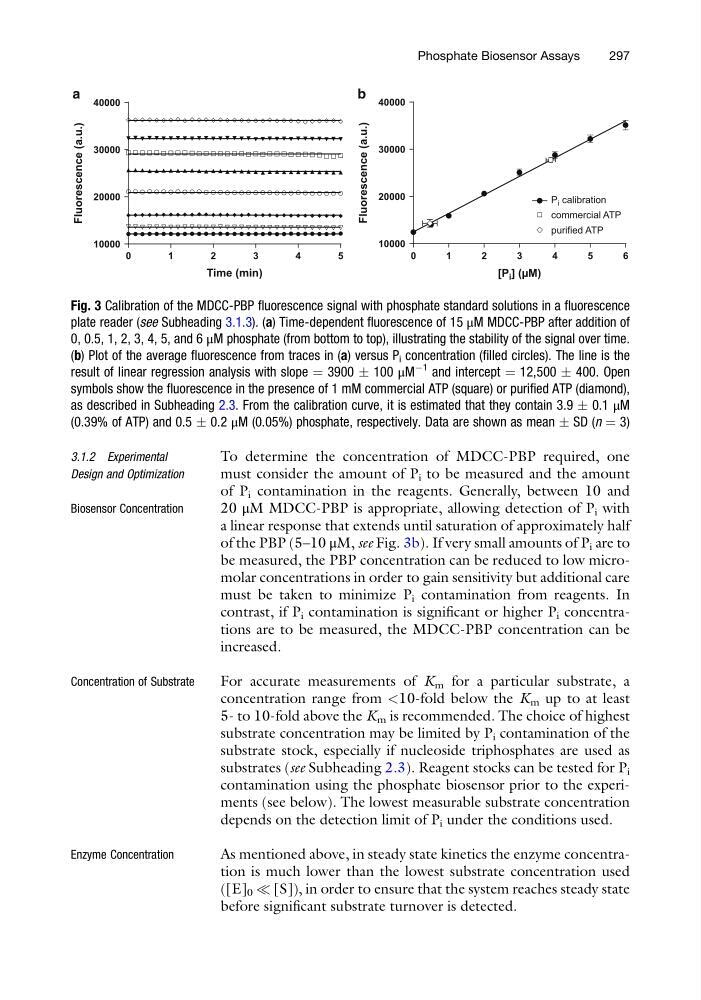
a linear response that extends until saturation of approximately half
of the PBP (5–10 μM, see Fig. 3b). If very small amounts of P i are to
be measured, the PBP concentration can be reduced to low micromolar concentrations in order to gain sensitivity but additional care
must be taken to minimize P i contamination from reagents. In
contrast, if P i contamination is significant or higher P i concentrations are to be measured, the MDCC-PBP concentration can be
increased.
Concentration of Substrate
For accurate measurements of K m for a particular substrate, a
concentration range from <10-fold below the K m up to at least
5- to 10-fold above the K m is recommended. The choice of highest
substrate concentration may be limited by P i contamination of the
substrate stock, especially if nucleoside triphosphates are used as
substrates (see Subheading 2.3). Reagent stocks can be tested for P i
contamination using the phosphate biosensor prior to the experiments (see below). The lowest measurable substrate concentration
depends on the detection limit of P i under the conditions used.
Enzyme Concentration
As mentioned above, in steady state kinetics the enzyme concentration is much lower than the lowest substrate concentration used
([E] 0 ( [S]), in order to ensure that the system reaches steady state
before significant substrate turnover is detected.
10000
0
1
2
3
4
5
0
1
2
3
4
5
6
20000
30000
40000
Time (min)
10000
20000
30000
40000
[P i ] (µM)
Fluorescence (a.u.)
commercial ATP
purified ATP
P i calibration
a
b
Fluorescence (a.u.)
Fig. 3 Calibration of the MDCC-PBP fluorescence signal with phosphate standard solutions in a fluorescence
plate reader (see Subheading 3.1.3). (a) Time-dependent fluorescence of 15 μM MDCC-PBP after addition of
0, 0.5, 1, 2, 3, 4, 5, and 6 μM phosphate (from bottom to top), illustrating the stability of the signal over time.
(b) Plot of the average fluorescence from traces in (a) versus P i concentration (filled circles). The line is the
result of linear regression analysis with slope ¼ 3900 Æ 100 μM
À1
and intercept ¼ 12,500 Æ 400. Open
symbols show the fluorescence in the presence of 1 mM commercial ATP (square) or purified ATP (diamond),
as described in Subheading 2.3. From the calibration curve, it is estimated that they contain 3.9 Æ 0.1 μM
(0.39% of ATP) and 0.5 Æ 0.2 μM (0.05%) phosphate, respectively. Data are shown as mean Æ SD (n ¼ 3)
Phosphate Biosensor Assays
297
Design and Optimization
Biosensor Concentration
To determine the concentration of MDCC-PBP required, one
must consider the amount of P i to be measured and the amount
of P i contamination in the reagents. Generally, between 10 and
20 μM MDCC-PBP is appropriate, allowing detection of P i with
a linear response that extends until saturation of approximately half
of the PBP (5–10 μM, see Fig. 3b). If very small amounts of P i are to
be measured, the PBP concentration can be reduced to low micromolar concentrations in order to gain sensitivity but additional care
must be taken to minimize P i contamination from reagents. In
contrast, if P i contamination is significant or higher P i concentrations are to be measured, the MDCC-PBP concentration can be
increased.
Concentration of Substrate
For accurate measurements of K m for a particular substrate, a
concentration range from <10-fold below the K m up to at least
5- to 10-fold above the K m is recommended. The choice of highest
substrate concentration may be limited by P i contamination of the
substrate stock, especially if nucleoside triphosphates are used as
substrates (see Subheading 2.3). Reagent stocks can be tested for P i
contamination using the phosphate biosensor prior to the experiments (see below). The lowest measurable substrate concentration
depends on the detection limit of P i under the conditions used.
Enzyme Concentration
As mentioned above, in steady state kinetics the enzyme concentration is much lower than the lowest substrate concentration used
([E] 0 ( [S]), in order to ensure that the system reaches steady state
before significant substrate turnover is detected.
10000
0
1
2
3
4
5
0
1
2
3
4
5
6
20000
30000
40000
Time (min)
10000
20000
30000
40000
[P i ] (µM)
Fluorescence (a.u.)
commercial ATP
purified ATP
P i calibration
a
b
Fluorescence (a.u.)
Fig. 3 Calibration of the MDCC-PBP fluorescence signal with phosphate standard solutions in a fluorescence
plate reader (see Subheading 3.1.3). (a) Time-dependent fluorescence of 15 μM MDCC-PBP after addition of
0, 0.5, 1, 2, 3, 4, 5, and 6 μM phosphate (from bottom to top), illustrating the stability of the signal over time.
(b) Plot of the average fluorescence from traces in (a) versus P i concentration (filled circles). The line is the
result of linear regression analysis with slope ¼ 3900 Æ 100 μM
À1
and intercept ¼ 12,500 Æ 400. Open
symbols show the fluorescence in the presence of 1 mM commercial ATP (square) or purified ATP (diamond),
as described in Subheading 2.3. From the calibration curve, it is estimated that they contain 3.9 Æ 0.1 μM
(0.39% of ATP) and 0.5 Æ 0.2 μM (0.05%) phosphate, respectively. Data are shown as mean Æ SD (n ¼ 3)
Phosphate Biosensor Assays
297