

very different turnover rates, for example, in the case when comparing enzyme mutations that significantly alter the rate of substrate turnover or comparing activity in the absence and presence of
an activator (see Fig. 4c).
0
1 0
2 0
3 0
4 0
5 0
6 0
10000
20000
30000
40000
50000
Time (min)
Fluorescence (a.u.)
initial
disturbances
saturation of PBP
500 µM ATP
25 µM ATP
substrate depletion
0.0
0.2
0.4
0.6
0.8
1.0
0
1
2
3
[ATP] (mM)
Rate/[E]
0 (s
-1
)
k cat
K m
k cat
2
steady state
turnover
a
b
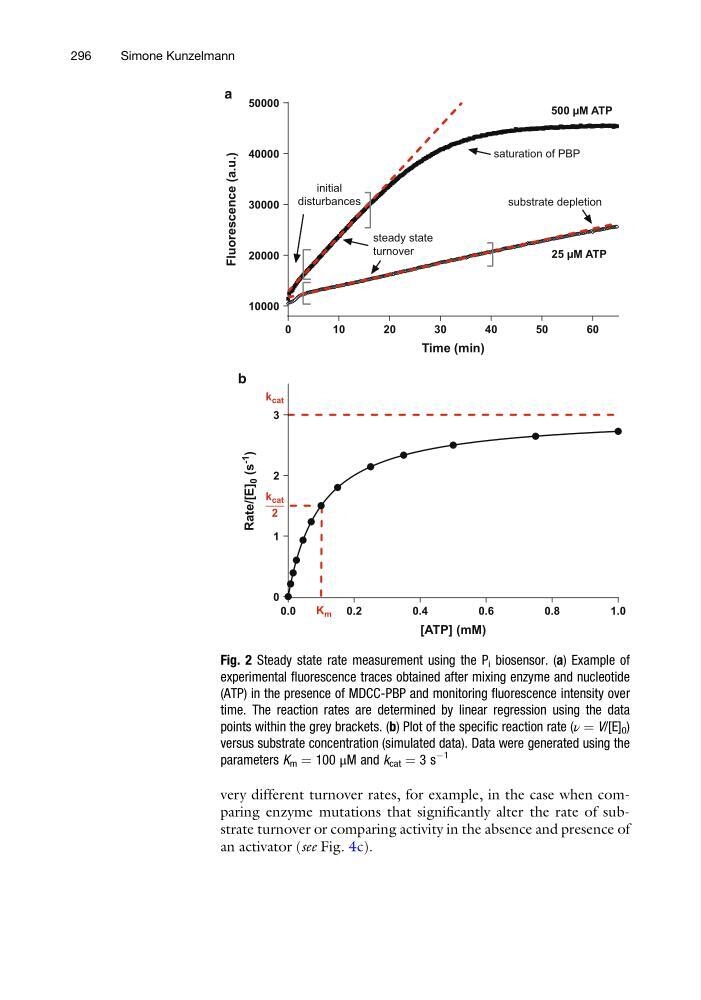
Fig. 2 Steady state rate measurement using the P i biosensor. (a) Example of
experimental fluorescence traces obtained after mixing enzyme and nucleotide
(ATP) in the presence of MDCC-PBP and monitoring fluorescence intensity over
time. The reaction rates are determined by linear regression using the data
points within the grey brackets. (b) Plot of the specific reaction rate (ν ¼ V/[E] 0 )
versus substrate concentration (simulated data). Data were generated using the
parameters K m ¼ 100 μM and k cat ¼ 3 s
À1
296
Simone Kunzelmann
an activator (see Fig. 4c).
0
1 0
2 0
3 0
4 0
5 0
6 0
10000
20000
30000
40000
50000
Time (min)
Fluorescence (a.u.)
initial
disturbances
saturation of PBP
500 µM ATP
25 µM ATP
substrate depletion
0.0
0.2
0.4
0.6
0.8
1.0
0
1
2
3
[ATP] (mM)
Rate/[E]
0 (s
-1
)
k cat
K m
k cat
2
steady state
turnover
a
b
Fig. 2 Steady state rate measurement using the P i biosensor. (a) Example of
experimental fluorescence traces obtained after mixing enzyme and nucleotide
(ATP) in the presence of MDCC-PBP and monitoring fluorescence intensity over
time. The reaction rates are determined by linear regression using the data
points within the grey brackets. (b) Plot of the specific reaction rate (ν ¼ V/[E] 0 )
versus substrate concentration (simulated data). Data were generated using the
parameters K m ¼ 100 μM and k cat ¼ 3 s
À1
296
Simone Kunzelmann