

The rate of the reaction (V) is directly proportional to the
enzyme concentration (see Eq. 2). Thus, the enzyme concentration
can be used to control the rate of the reaction. In practice, the assay
works well if a few micromolar P i are produced over 10 min at the
highest substrate concentration and the maximal measurement
time is ~20–60 min. If the enzyme concentration is too low and
0
1 0
2 0
3 0
4 0
10000
20000
30000
40000
Time (min)
Fluorescence (a.u.)
0
200
400
600
800
0.00
0.02
0.04
0.06
[ATP] (µM)
Rate/[Chd1] (s
-1
)
0
200
400
600
800
0
1
2
3
[ATP] (µM)
Rate/[Chd1] (s
-1
)
no DNA
400 nM dsDNA
c
b
a
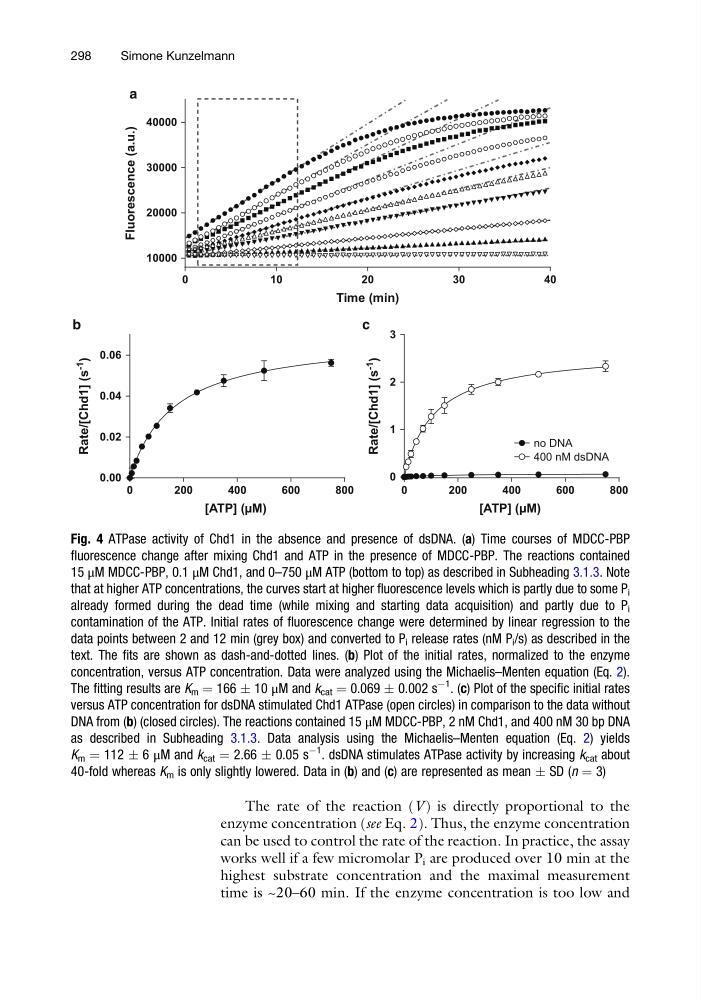
Fig. 4 ATPase activity of Chd1 in the absence and presence of dsDNA. (a) Time courses of MDCC-PBP
fluorescence change after mixing Chd1 and ATP in the presence of MDCC-PBP. The reactions contained
15 μM MDCC-PBP, 0.1 μM Chd1, and 0–750 μM ATP (bottom to top) as described in Subheading 3.1.3. Note
that at higher ATP concentrations, the curves start at higher fluorescence levels which is partly due to some P i
already formed during the dead time (while mixing and starting data acquisition) and partly due to P i
contamination of the ATP. Initial rates of fluorescence change were determined by linear regression to the
data points between 2 and 12 min (grey box) and converted to P i release rates (nM P i /s) as described in the
text. The fits are shown as dash-and-dotted lines. (b) Plot of the initial rates, normalized to the enzyme
concentration, versus ATP concentration. Data were analyzed using the Michaelis–Menten equation (Eq. 2).
The fitting results are K m ¼ 166 Æ 10 μM and k cat ¼ 0.069 Æ 0.002 s
À1
. (c) Plot of the specific initial rates
versus ATP concentration for dsDNA stimulated Chd1 ATPase (open circles) in comparison to the data without
DNA from (b) (closed circles). The reactions contained 15 μM MDCC-PBP, 2 nM Chd1, and 400 nM 30 bp DNA
as described in Subheading 3.1.3. Data analysis using the Michaelis–Menten equation (Eq. 2) yields
K m ¼ 112 Æ 6 μM and k cat ¼ 2.66 Æ 0.05 s
À1
. dsDNA stimulates ATPase activity by increasing k cat about
40-fold whereas K m is only slightly lowered. Data in (b) and (c) are represented as mean Æ SD (n ¼ 3)
298
Simone Kunzelmann
enzyme concentration (see Eq. 2). Thus, the enzyme concentration
can be used to control the rate of the reaction. In practice, the assay
works well if a few micromolar P i are produced over 10 min at the
highest substrate concentration and the maximal measurement
time is ~20–60 min. If the enzyme concentration is too low and
0
1 0
2 0
3 0
4 0
10000
20000
30000
40000
Time (min)
Fluorescence (a.u.)
0
200
400
600
800
0.00
0.02
0.04
0.06
[ATP] (µM)
Rate/[Chd1] (s
-1
)
0
200
400
600
800
0
1
2
3
[ATP] (µM)
Rate/[Chd1] (s
-1
)
no DNA
400 nM dsDNA
c
b
a
Fig. 4 ATPase activity of Chd1 in the absence and presence of dsDNA. (a) Time courses of MDCC-PBP
fluorescence change after mixing Chd1 and ATP in the presence of MDCC-PBP. The reactions contained
15 μM MDCC-PBP, 0.1 μM Chd1, and 0–750 μM ATP (bottom to top) as described in Subheading 3.1.3. Note
that at higher ATP concentrations, the curves start at higher fluorescence levels which is partly due to some P i
already formed during the dead time (while mixing and starting data acquisition) and partly due to P i
contamination of the ATP. Initial rates of fluorescence change were determined by linear regression to the
data points between 2 and 12 min (grey box) and converted to P i release rates (nM P i /s) as described in the
text. The fits are shown as dash-and-dotted lines. (b) Plot of the initial rates, normalized to the enzyme
concentration, versus ATP concentration. Data were analyzed using the Michaelis–Menten equation (Eq. 2).
The fitting results are K m ¼ 166 Æ 10 μM and k cat ¼ 0.069 Æ 0.002 s
À1
. (c) Plot of the specific initial rates
versus ATP concentration for dsDNA stimulated Chd1 ATPase (open circles) in comparison to the data without
DNA from (b) (closed circles). The reactions contained 15 μM MDCC-PBP, 2 nM Chd1, and 400 nM 30 bp DNA
as described in Subheading 3.1.3. Data analysis using the Michaelis–Menten equation (Eq. 2) yields
K m ¼ 112 Æ 6 μM and k cat ¼ 2.66 Æ 0.05 s
À1
. dsDNA stimulates ATPase activity by increasing k cat about
40-fold whereas K m is only slightly lowered. Data in (b) and (c) are represented as mean Æ SD (n ¼ 3)
298
Simone Kunzelmann