

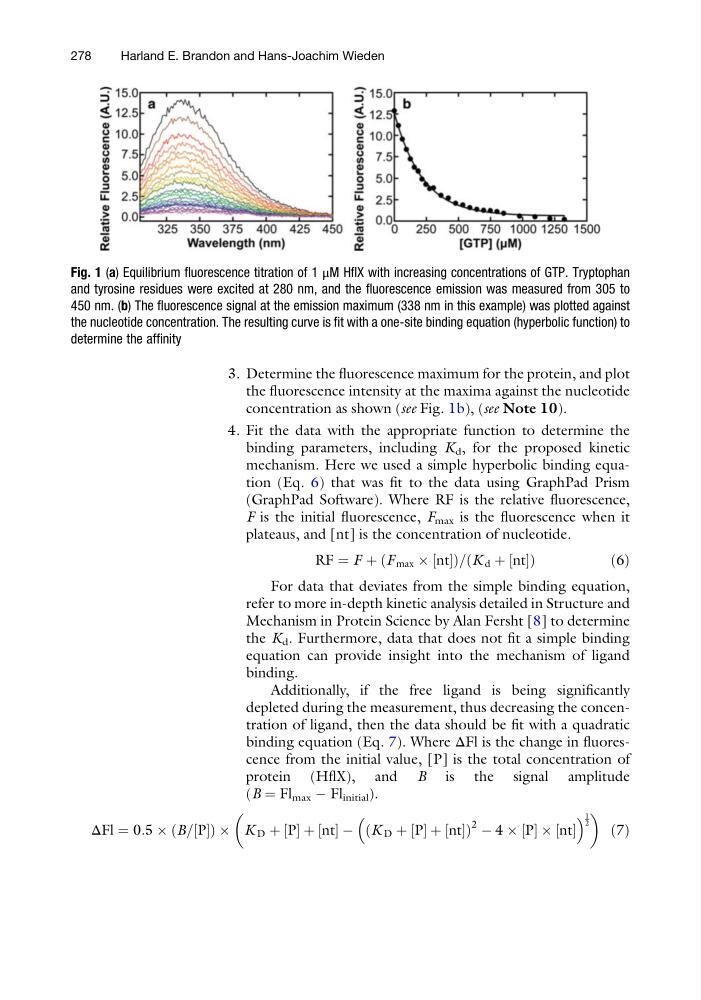
3. Determine the fluorescence maximum for the protein, and plot
the fluorescence intensity at the maxima against the nucleotide
concentration as shown (see Fig. 1b), (see Note 10).
4. Fit the data with the appropriate function to determine the
binding parameters, including K d , for the proposed kinetic
mechanism. Here we used a simple hyperbolic binding equation (Eq. 6) that was fit to the data using GraphPad Prism
(GraphPad Software). Where RF is the relative fluorescence,
F is the initial fluorescence, F max is the fluorescence when it
plateaus, and [nt] is the concentration of nucleotide.
RF ¼ F þ F max  nt
½
ð
Þ = K d þ nt
½
ð
Þ
ð 6Þ
For data that deviates from the simple binding equation,
refer to more in-depth kinetic analysis detailed in Structure and
Mechanism in Protein Science by Alan Fersht [8] to determine
the K d . Furthermore, data that does not fit a simple binding
equation can provide insight into the mechanism of ligand
binding.
Additionally, if the free ligand is being significantly
depleted during the measurement, thus decreasing the concentration of ligand, then the data should be fit with a quadratic
binding equation (Eq. 7). Where ΔFl is the change in fluorescence from the initial value, [P] is the total concentration of
protein (HflX), and B is the signal amplitude
(B ¼ Fl max À Fl initial ).
ΔFl ¼ 0:5 Â B= P
½
ð
ÞÂ K D þ P
½ þ nt
½ À K D þ P
½ þ nt
½
ð
Þ
2 À 4 Â P
½ Â nt
½
1
2
ð7Þ
Fig. 1 (a) Equilibrium fluorescence titration of 1 μM HflX with increasing concentrations of GTP. Tryptophan
and tyrosine residues were excited at 280 nm, and the fluorescence emission was measured from 305 to
450 nm. (b) The fluorescence signal at the emission maximum (338 nm in this example) was plotted against
the nucleotide concentration. The resulting curve is fit with a one-site binding equation (hyperbolic function) to
determine the affinity
278
Harland E. Brandon and Hans-Joachim Wieden
the fluorescence intensity at the maxima against the nucleotide
concentration as shown (see Fig. 1b), (see Note 10).
4. Fit the data with the appropriate function to determine the
binding parameters, including K d , for the proposed kinetic
mechanism. Here we used a simple hyperbolic binding equation (Eq. 6) that was fit to the data using GraphPad Prism
(GraphPad Software). Where RF is the relative fluorescence,
F is the initial fluorescence, F max is the fluorescence when it
plateaus, and [nt] is the concentration of nucleotide.
RF ¼ F þ F max  nt
½
ð
Þ = K d þ nt
½
ð
Þ
ð 6Þ
For data that deviates from the simple binding equation,
refer to more in-depth kinetic analysis detailed in Structure and
Mechanism in Protein Science by Alan Fersht [8] to determine
the K d . Furthermore, data that does not fit a simple binding
equation can provide insight into the mechanism of ligand
binding.
Additionally, if the free ligand is being significantly
depleted during the measurement, thus decreasing the concentration of ligand, then the data should be fit with a quadratic
binding equation (Eq. 7). Where ΔFl is the change in fluorescence from the initial value, [P] is the total concentration of
protein (HflX), and B is the signal amplitude
(B ¼ Fl max À Fl initial ).
ΔFl ¼ 0:5 Â B= P
½
ð
ÞÂ K D þ P
½ þ nt
½ À K D þ P
½ þ nt
½
ð
Þ
2 À 4 Â P
½ Â nt
½
1
2
ð7Þ
Fig. 1 (a) Equilibrium fluorescence titration of 1 μM HflX with increasing concentrations of GTP. Tryptophan
and tyrosine residues were excited at 280 nm, and the fluorescence emission was measured from 305 to
450 nm. (b) The fluorescence signal at the emission maximum (338 nm in this example) was plotted against
the nucleotide concentration. The resulting curve is fit with a one-site binding equation (hyperbolic function) to
determine the affinity
278
Harland E. Brandon and Hans-Joachim Wieden