

3.2 Pre-steady State
Nucleotide Binding
3.2.1 Experimental
Design
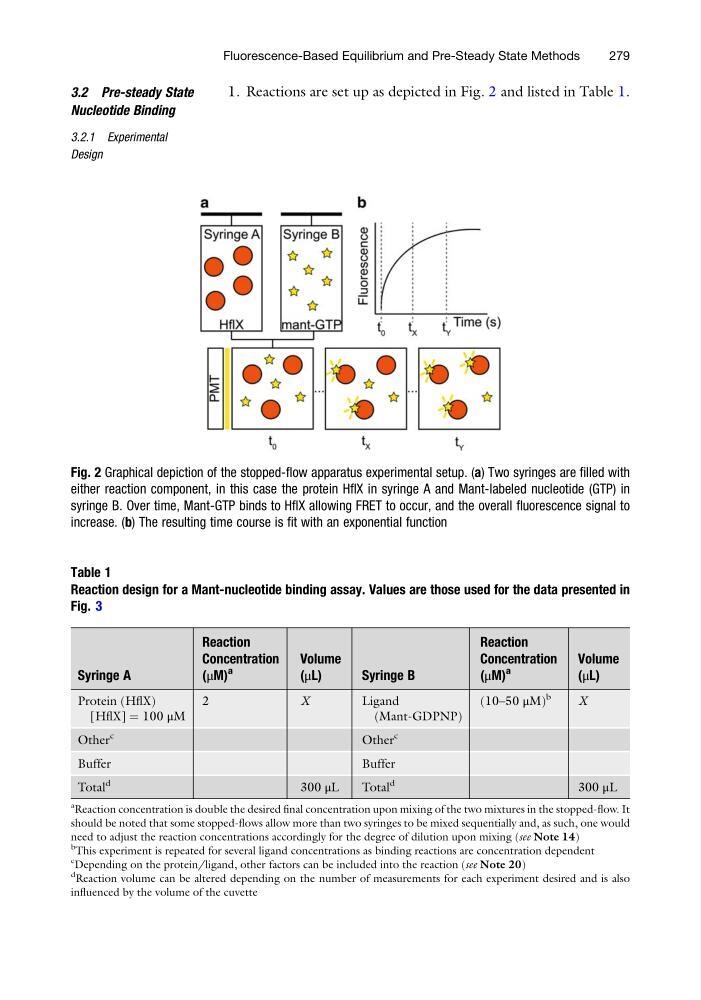
1. Reactions are set up as depicted in Fig. 2 and listed in Table 1.
Fig. 2 Graphical depiction of the stopped-flow apparatus experimental setup. (a) Two syringes are filled with
either reaction component, in this case the protein HflX in syringe A and Mant-labeled nucleotide (GTP) in
syringe B. Over time, Mant-GTP binds to HflX allowing FRET to occur, and the overall fluorescence signal to
increase. (b) The resulting time course is fit with an exponential function
Table 1
Reaction design for a Mant-nucleotide binding assay. Values are those used for the data presented in
Fig. 3
Syringe A
Reaction
Concentration
(μM)
a
Volume
(μL)
Syringe B
Reaction
Concentration
(μM)
a
Volume
(μL)
Protein (HflX)
[HflX] ¼ 100 μM
2
X
Ligand
(Mant-GDPNP)
(10–50 μM)
b
X
Other
c
Other
c
Buffer
Buffer
Total
d
300 μL
Total
d
300 μL
a
Reaction concentration is double the desired final concentration upon mixing of the two mixtures in the stopped-flow. It
should be noted that some stopped-flows allow more than two syringes to be mixed sequentially and, as such, one would
need to adjust the reaction concentrations accordingly for the degree of dilution upon mixing (see Note 14)
b
This experiment is repeated for several ligand concentrations as binding reactions are concentration dependent
c
Depending on the protein/ligand, other factors can be included into the reaction (see Note 20)
d
Reaction volume can be altered depending on the number of measurements for each experiment desired and is also
influenced by the volume of the cuvette
Fluorescence-Based Equilibrium and Pre-Steady State Methods
279
Nucleotide Binding
3.2.1 Experimental
Design
1. Reactions are set up as depicted in Fig. 2 and listed in Table 1.
Fig. 2 Graphical depiction of the stopped-flow apparatus experimental setup. (a) Two syringes are filled with
either reaction component, in this case the protein HflX in syringe A and Mant-labeled nucleotide (GTP) in
syringe B. Over time, Mant-GTP binds to HflX allowing FRET to occur, and the overall fluorescence signal to
increase. (b) The resulting time course is fit with an exponential function
Table 1
Reaction design for a Mant-nucleotide binding assay. Values are those used for the data presented in
Fig. 3
Syringe A
Reaction
Concentration
(μM)
a
Volume
(μL)
Syringe B
Reaction
Concentration
(μM)
a
Volume
(μL)
Protein (HflX)
[HflX] ¼ 100 μM
2
X
Ligand
(Mant-GDPNP)
(10–50 μM)
b
X
Other
c
Other
c
Buffer
Buffer
Total
d
300 μL
Total
d
300 μL
a
Reaction concentration is double the desired final concentration upon mixing of the two mixtures in the stopped-flow. It
should be noted that some stopped-flows allow more than two syringes to be mixed sequentially and, as such, one would
need to adjust the reaction concentrations accordingly for the degree of dilution upon mixing (see Note 14)
b
This experiment is repeated for several ligand concentrations as binding reactions are concentration dependent
c
Depending on the protein/ligand, other factors can be included into the reaction (see Note 20)
d
Reaction volume can be altered depending on the number of measurements for each experiment desired and is also
influenced by the volume of the cuvette
Fluorescence-Based Equilibrium and Pre-Steady State Methods
279