

concentration [1, 2], as long as the buffer does not absorb light
significantly in this wavelength regime.
The absorbance measured at 280, 214, or 205 nm can be used
to calculate the sample concentration employing the protein molar
absorption coefficient at the working wavelength and the Beer–
Lambert law.
A i ¼ ε i Á c Á d
ð1Þ
with A i being the absorption at wavelength i, ε i the molar absorption coefficient at that wavelength, c the concentration (M), and
d the cuvette path length (cm).
Independent of the wavelength used for concentration determination, the sample must be pure, i.e., not contain other protein(s)
as contaminants, as such impurities will falsify the concentration.
The advantages of UV absorbance-based protein quantification are
that (1) the sample can be recovered, (2) it is accurate as long as the
extinction coefficient is known, and (3) there is less variability as
compared to colorimetric reactions as the latter are strongly dependent on the protein composition, which will be different from the
one used as a standard [3].
In addition to the determination of the concentration, UV
spectroscopy is a very convenient tool for detecting nonprotein
contaminants. Firstly, nucleic acids have an absorption maximum
at 260 nm and reducing agents (especially dithiothreitol (DTT))
[2, 4] at 250 nm. Thus, both kinds of contaminants will alter the
shape of the 280 nm absorbance peak of the sample, resulting in a
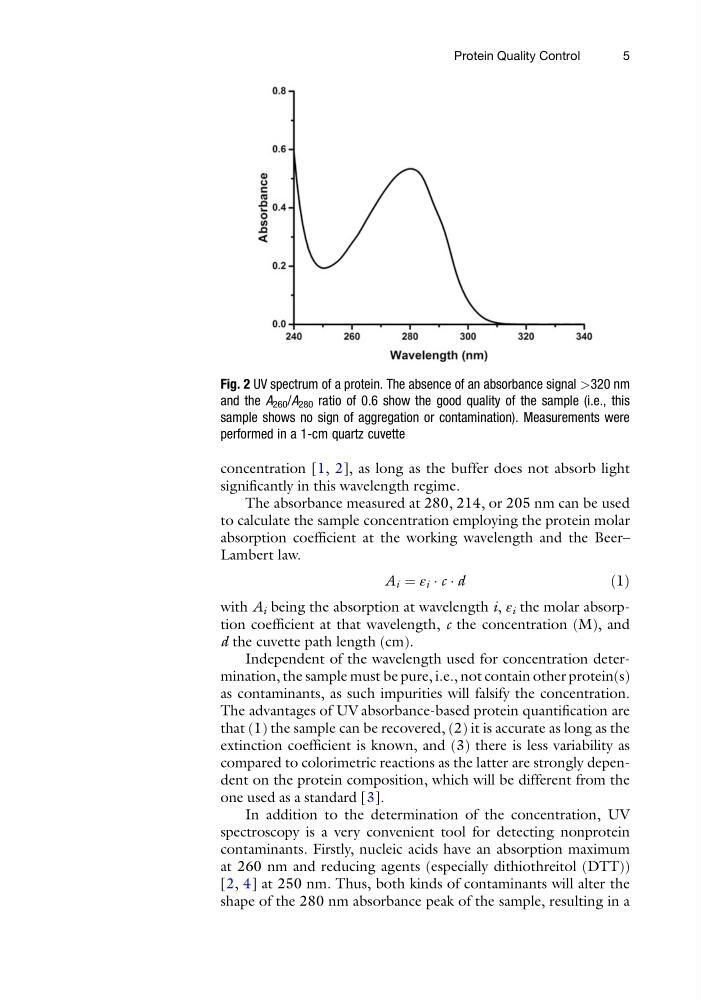
Fig. 2 UV spectrum of a protein. The absence of an absorbance signal >320 nm
and the A 260 /A 280 ratio of 0.6 show the good quality of the sample (i.e., this
sample shows no sign of aggregation or contamination). Measurements were
performed in a 1-cm quartz cuvette
Protein Quality Control
5
significantly in this wavelength regime.
The absorbance measured at 280, 214, or 205 nm can be used
to calculate the sample concentration employing the protein molar
absorption coefficient at the working wavelength and the Beer–
Lambert law.
A i ¼ ε i Á c Á d
ð1Þ
with A i being the absorption at wavelength i, ε i the molar absorption coefficient at that wavelength, c the concentration (M), and
d the cuvette path length (cm).
Independent of the wavelength used for concentration determination, the sample must be pure, i.e., not contain other protein(s)
as contaminants, as such impurities will falsify the concentration.
The advantages of UV absorbance-based protein quantification are
that (1) the sample can be recovered, (2) it is accurate as long as the
extinction coefficient is known, and (3) there is less variability as
compared to colorimetric reactions as the latter are strongly dependent on the protein composition, which will be different from the
one used as a standard [3].
In addition to the determination of the concentration, UV
spectroscopy is a very convenient tool for detecting nonprotein
contaminants. Firstly, nucleic acids have an absorption maximum
at 260 nm and reducing agents (especially dithiothreitol (DTT))
[2, 4] at 250 nm. Thus, both kinds of contaminants will alter the
shape of the 280 nm absorbance peak of the sample, resulting in a
Fig. 2 UV spectrum of a protein. The absence of an absorbance signal >320 nm
and the A 260 /A 280 ratio of 0.6 show the good quality of the sample (i.e., this
sample shows no sign of aggregation or contamination). Measurements were
performed in a 1-cm quartz cuvette
Protein Quality Control
5