

high A 260 /A 280 ratio (>0.6) [5]. Secondly, UV spectroscopy can
detect the presence of large particles. Aggregate-free protein samples do not absorb light at wavelengths >320 nm. Thus, an absorbance signal above 320 nm can be attributed exclusively to the
scattering of light by large aggregates (hydrodynamic radius larger
than 200 nm) present in the sample.
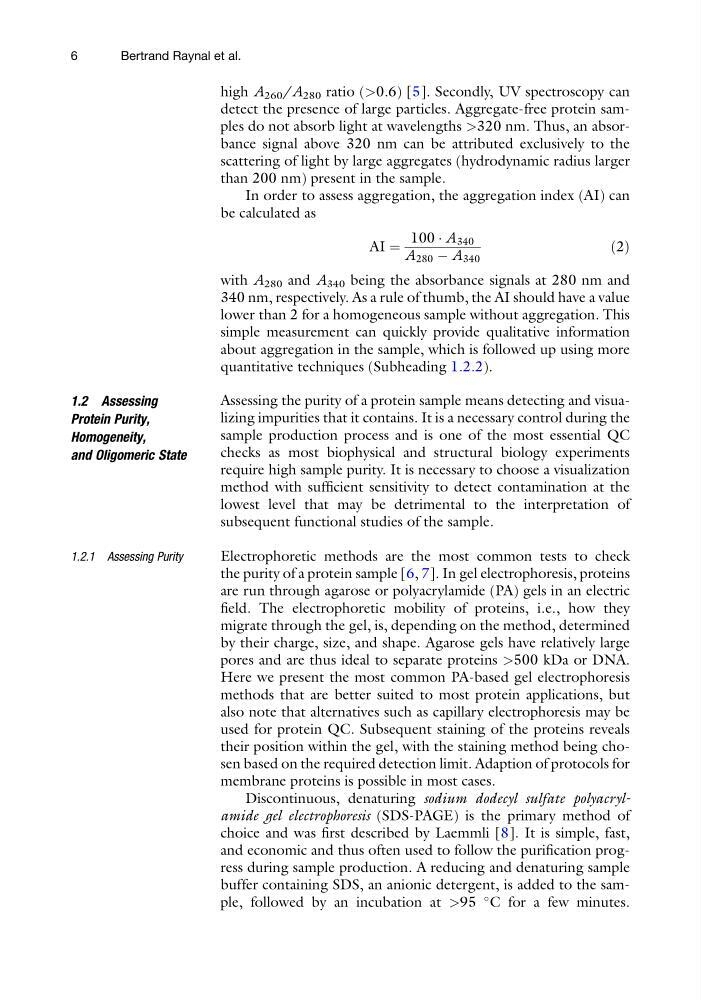
In order to assess aggregation, the aggregation index (AI) can
be calculated as
AI ¼
100 Á A 340
A 280 À A 340
ð2Þ
with A 280 and A 340 being the absorbance signals at 280 nm and
340 nm, respectively. As a rule of thumb, the AI should have a value
lower than 2 for a homogeneous sample without aggregation. This
simple measurement can quickly provide qualitative information
about aggregation in the sample, which is followed up using more
quantitative techniques (Subheading 1.2.2).
1.2 Assessing
Protein Purity,
Homogeneity,
and Oligomeric State
Assessing the purity of a protein sample means detecting and visualizing impurities that it contains. It is a necessary control during the
sample production process and is one of the most essential QC
checks as most biophysical and structural biology experiments
require high sample purity. It is necessary to choose a visualization
method with sufficient sensitivity to detect contamination at the
lowest level that may be detrimental to the interpretation of
subsequent functional studies of the sample.
1.2.1 Assessing Purity
Electrophoretic methods are the most common tests to check
the purity of a protein sample [6, 7]. In gel electrophoresis, proteins
are run through agarose or polyacrylamide (PA) gels in an electric
field. The electrophoretic mobility of proteins, i.e., how they
migrate through the gel, is, depending on the method, determined
by their charge, size, and shape. Agarose gels have relatively large
pores and are thus ideal to separate proteins >500 kDa or DNA.
Here we present the most common PA-based gel electrophoresis
methods that are better suited to most protein applications, but
also note that alternatives such as capillary electrophoresis may be
used for protein QC. Subsequent staining of the proteins reveals
their position within the gel, with the staining method being chosen based on the required detection limit. Adaption of protocols for
membrane proteins is possible in most cases.
Discontinuous, denaturing sodium dodecyl sulfate polyacrylamide gel electrophoresis (SDS-PAGE) is the primary method of
choice and was first described by Laemmli [8]. It is simple, fast,
and economic and thus often used to follow the purification progress during sample production. A reducing and denaturing sample
buffer containing SDS, an anionic detergent, is added to the sample, followed by an incubation at >95
C for a few minutes.
6
Bertrand Raynal et al.
detect the presence of large particles. Aggregate-free protein samples do not absorb light at wavelengths >320 nm. Thus, an absorbance signal above 320 nm can be attributed exclusively to the
scattering of light by large aggregates (hydrodynamic radius larger
than 200 nm) present in the sample.
In order to assess aggregation, the aggregation index (AI) can
be calculated as
AI ¼
100 Á A 340
A 280 À A 340
ð2Þ
with A 280 and A 340 being the absorbance signals at 280 nm and
340 nm, respectively. As a rule of thumb, the AI should have a value
lower than 2 for a homogeneous sample without aggregation. This
simple measurement can quickly provide qualitative information
about aggregation in the sample, which is followed up using more
quantitative techniques (Subheading 1.2.2).
1.2 Assessing
Protein Purity,
Homogeneity,
and Oligomeric State
Assessing the purity of a protein sample means detecting and visualizing impurities that it contains. It is a necessary control during the
sample production process and is one of the most essential QC
checks as most biophysical and structural biology experiments
require high sample purity. It is necessary to choose a visualization
method with sufficient sensitivity to detect contamination at the
lowest level that may be detrimental to the interpretation of
subsequent functional studies of the sample.
1.2.1 Assessing Purity
Electrophoretic methods are the most common tests to check
the purity of a protein sample [6, 7]. In gel electrophoresis, proteins
are run through agarose or polyacrylamide (PA) gels in an electric
field. The electrophoretic mobility of proteins, i.e., how they
migrate through the gel, is, depending on the method, determined
by their charge, size, and shape. Agarose gels have relatively large
pores and are thus ideal to separate proteins >500 kDa or DNA.
Here we present the most common PA-based gel electrophoresis
methods that are better suited to most protein applications, but
also note that alternatives such as capillary electrophoresis may be
used for protein QC. Subsequent staining of the proteins reveals
their position within the gel, with the staining method being chosen based on the required detection limit. Adaption of protocols for
membrane proteins is possible in most cases.
Discontinuous, denaturing sodium dodecyl sulfate polyacrylamide gel electrophoresis (SDS-PAGE) is the primary method of
choice and was first described by Laemmli [8]. It is simple, fast,
and economic and thus often used to follow the purification progress during sample production. A reducing and denaturing sample
buffer containing SDS, an anionic detergent, is added to the sample, followed by an incubation at >95
C for a few minutes.
6
Bertrand Raynal et al.