

where r L and r PL are the anisotropies of L and PL, and D is the
fluorescence intensity of PL divided by that of L.
8. Many artifacts can occur in stopped-flow experiments and
some of them can give rise to apparently perfect exponentials.
One of the most common problems is the presence of air
bubbles in the observation cell, and it is therefore advisable to
use degassed solutions for all stopped-flow measurements.
Inefficient mixing, poor thermal equilibration, and small leaks
in the system may all give rise to apparently real transients.
Mixing solutions with very different densities may also be
problematic. A suitable control experiment will usually identify
problems. For example, if the reaction being studied is that of a
fluorescently labeled protein with a ligand, the control would
be to mix the protein solution with the ligand solution, but
with the ligand omitted.
9. Whenever possible, it is best to determine the variance in k obs
values for each value of the independent concentration variable,
[X tot ]. The resulting sample variances may then be used to
weight each k obs value by the inverse of its estimated variance.
In some cases, it may not be possible to obtain variances for
individual samples, and it is then reasonable to assume that the
relative error in k obs is constant. The fitting should then be
done to the logarithm of k obs , since the error in log(k obs ) will be
constant. This is particularly important in cases where k obs
values vary by more than an order of magnitude.
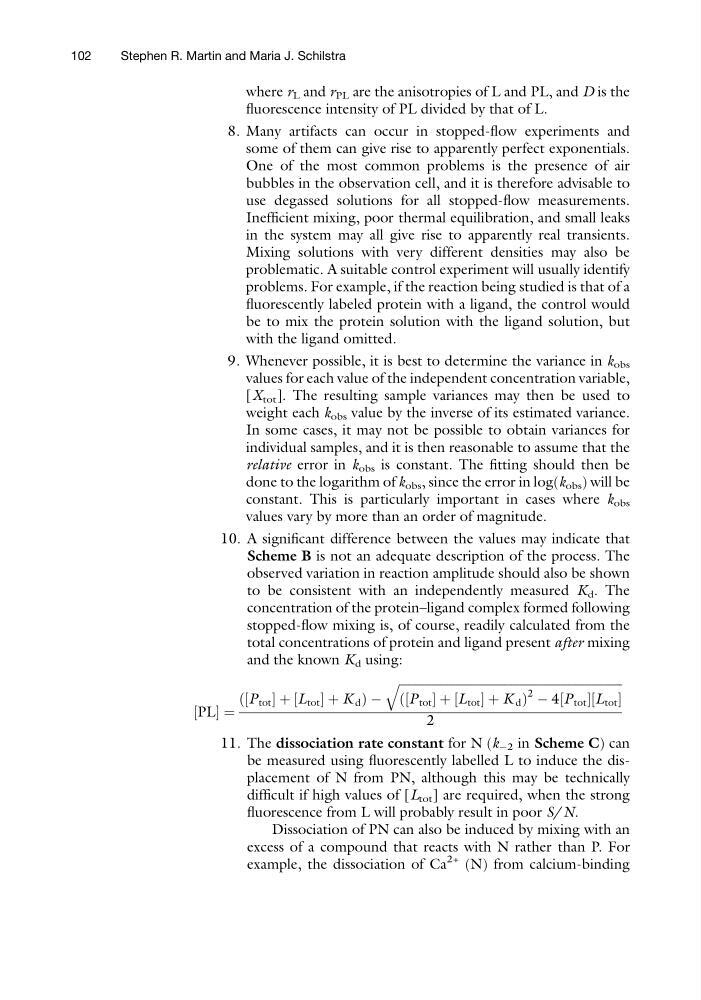
10. A significant difference between the values may indicate that
Scheme B is not an adequate description of the process. The
observed variation in reaction amplitude should also be shown
to be consistent with an independently measured K d . The
concentration of the protein–ligand complex formed following
stopped-flow mixing is, of course, readily calculated from the
total concentrations of protein and ligand present after mixing
and the known K d using:
PL
½ ¼
P tot
½
þ L tot
½
þK d
ð
Þ À
ffiffiffiffiffiffiffiffiffiffiffiffiffiffiffiffiffiffiffiffiffiffiffiffiffiffiffiffiffiffiffiffiffiffiffiffiffiffiffiffiffiffiffiffiffiffiffiffiffiffiffiffiffiffiffiffiffiffiffiffiffiffiffiffiffiffiffiffiffiffiffiffiffiffi
P tot
½
þ L tot
½
þK d
ð
Þ
2 À 4 P tot
½
L tot
½
q
2
11. The dissociation rate constant for N (k À2 in Scheme C) can
be measured using fluorescently labelled L to induce the displacement of N from PN, although this may be technically
difficult if high values of [L tot ] are required, when the strong
fluorescence from L will probably result in poor S/N.
Dissociation of PN can also be induced by mixing with an
excess of a compound that reacts with N rather than P. For
example, the dissociation of Ca
2+ (N) from calcium-binding
102
Stephen R. Martin and Maria J. Schilstra
fluorescence intensity of PL divided by that of L.
8. Many artifacts can occur in stopped-flow experiments and
some of them can give rise to apparently perfect exponentials.
One of the most common problems is the presence of air
bubbles in the observation cell, and it is therefore advisable to
use degassed solutions for all stopped-flow measurements.
Inefficient mixing, poor thermal equilibration, and small leaks
in the system may all give rise to apparently real transients.
Mixing solutions with very different densities may also be
problematic. A suitable control experiment will usually identify
problems. For example, if the reaction being studied is that of a
fluorescently labeled protein with a ligand, the control would
be to mix the protein solution with the ligand solution, but
with the ligand omitted.
9. Whenever possible, it is best to determine the variance in k obs
values for each value of the independent concentration variable,
[X tot ]. The resulting sample variances may then be used to
weight each k obs value by the inverse of its estimated variance.
In some cases, it may not be possible to obtain variances for
individual samples, and it is then reasonable to assume that the
relative error in k obs is constant. The fitting should then be
done to the logarithm of k obs , since the error in log(k obs ) will be
constant. This is particularly important in cases where k obs
values vary by more than an order of magnitude.
10. A significant difference between the values may indicate that
Scheme B is not an adequate description of the process. The
observed variation in reaction amplitude should also be shown
to be consistent with an independently measured K d . The
concentration of the protein–ligand complex formed following
stopped-flow mixing is, of course, readily calculated from the
total concentrations of protein and ligand present after mixing
and the known K d using:
PL
½ ¼
P tot
½
þ L tot
½
þK d
ð
Þ À
ffiffiffiffiffiffiffiffiffiffiffiffiffiffiffiffiffiffiffiffiffiffiffiffiffiffiffiffiffiffiffiffiffiffiffiffiffiffiffiffiffiffiffiffiffiffiffiffiffiffiffiffiffiffiffiffiffiffiffiffiffiffiffiffiffiffiffiffiffiffiffiffiffiffi
P tot
½
þ L tot
½
þK d
ð
Þ
2 À 4 P tot
½
L tot
½
q
2
11. The dissociation rate constant for N (k À2 in Scheme C) can
be measured using fluorescently labelled L to induce the displacement of N from PN, although this may be technically
difficult if high values of [L tot ] are required, when the strong
fluorescence from L will probably result in poor S/N.
Dissociation of PN can also be induced by mixing with an
excess of a compound that reacts with N rather than P. For
example, the dissociation of Ca
2+ (N) from calcium-binding
102
Stephen R. Martin and Maria J. Schilstra