

PX are not the same then the presence of X alters the affinity for Y
and the system is cooperative.
3.4 Multistep
Reactions
Although many protein–ligand interactions conform to Scheme B,
this is not always the case. The most obvious indication of additional complexity is the observation of more than a single kinetic
phase, i.e., a time course of fluorescence change does not fit to a
single exponential. Or, when only a single kinetic phase is observed,
complexity is most often indicated by the observation that the
variation in k obs with concentration is not linear. One of the most
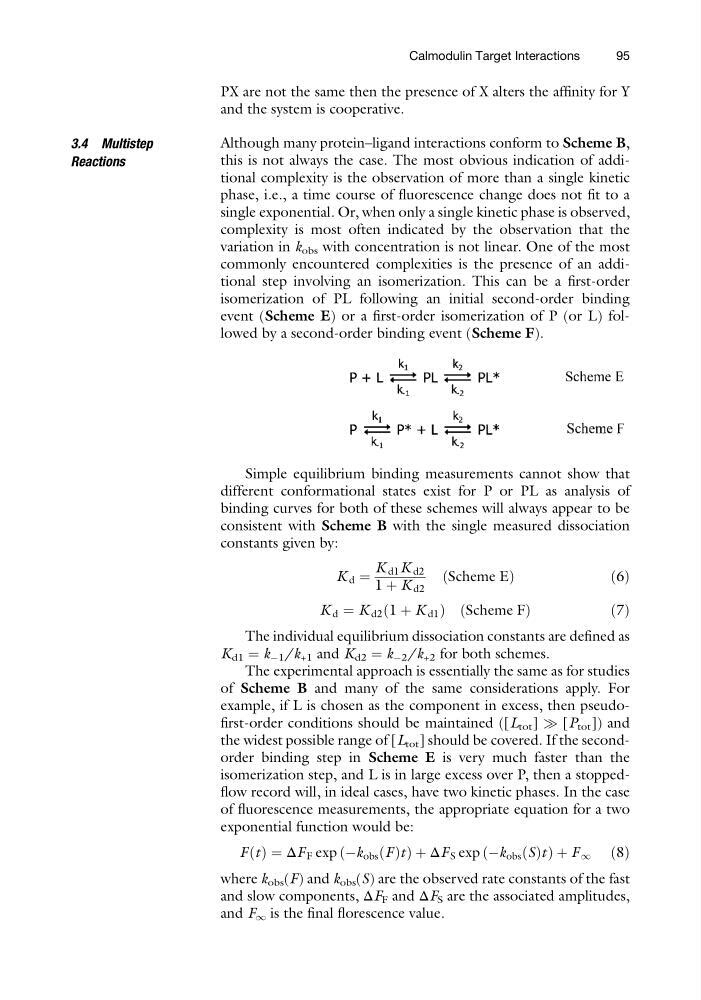
commonly encountered complexities is the presence of an additional step involving an isomerization. This can be a first-order
isomerization of PL following an initial second-order binding
event (Scheme E) or a first-order isomerization of P (or L) followed by a second-order binding event (Scheme F).
Simple equilibrium binding measurements cannot show that
different conformational states exist for P or PL as analysis of
binding curves for both of these schemes will always appear to be
consistent with Scheme B with the single measured dissociation
constants given by:
K d ¼
K d1 K d2
1 þ K d2
Scheme E
ð
Þ
ð 6Þ
K d ¼ K d2 1 þ K d1
ð
Þ Scheme F
ð
Þ
ð 7Þ
The individual equilibrium dissociation constants are defined as
K d1 ¼ k À1 /k +1 and K d2 ¼ k À2 /k +2 for both schemes.
The experimental approach is essentially the same as for studies
of Scheme B and many of the same considerations apply. For
example, if L is chosen as the component in excess, then pseudofirst-order conditions should be maintained ([L tot ] ) [P tot ]) and
the widest possible range of [L tot ] should be covered. If the secondorder binding step in Scheme E is very much faster than the
isomerization step, and L is in large excess over P, then a stoppedflow record will, in ideal cases, have two kinetic phases. In the case
of fluorescence measurements, the appropriate equation for a two
exponential function would be:
F t
ð Þ ¼ ΔF F exp Àk obs F
ð Þt
ð
ÞþΔF S exp Àk obs S
ð Þt
ð
ÞþF 1 ð8Þ
where k obs (F) and k obs (S) are the observed rate constants of the fast
and slow components, ΔF F and ΔF S are the associated amplitudes,
and F 1 is the final florescence value.
Calmodulin Target Interactions
95
and the system is cooperative.
3.4 Multistep
Reactions
Although many protein–ligand interactions conform to Scheme B,
this is not always the case. The most obvious indication of additional complexity is the observation of more than a single kinetic
phase, i.e., a time course of fluorescence change does not fit to a
single exponential. Or, when only a single kinetic phase is observed,
complexity is most often indicated by the observation that the
variation in k obs with concentration is not linear. One of the most
commonly encountered complexities is the presence of an additional step involving an isomerization. This can be a first-order
isomerization of PL following an initial second-order binding
event (Scheme E) or a first-order isomerization of P (or L) followed by a second-order binding event (Scheme F).
Simple equilibrium binding measurements cannot show that
different conformational states exist for P or PL as analysis of
binding curves for both of these schemes will always appear to be
consistent with Scheme B with the single measured dissociation
constants given by:
K d ¼
K d1 K d2
1 þ K d2
Scheme E
ð
Þ
ð 6Þ
K d ¼ K d2 1 þ K d1
ð
Þ Scheme F
ð
Þ
ð 7Þ
The individual equilibrium dissociation constants are defined as
K d1 ¼ k À1 /k +1 and K d2 ¼ k À2 /k +2 for both schemes.
The experimental approach is essentially the same as for studies
of Scheme B and many of the same considerations apply. For
example, if L is chosen as the component in excess, then pseudofirst-order conditions should be maintained ([L tot ] ) [P tot ]) and
the widest possible range of [L tot ] should be covered. If the secondorder binding step in Scheme E is very much faster than the
isomerization step, and L is in large excess over P, then a stoppedflow record will, in ideal cases, have two kinetic phases. In the case
of fluorescence measurements, the appropriate equation for a two
exponential function would be:
F t
ð Þ ¼ ΔF F exp Àk obs F
ð Þt
ð
ÞþΔF S exp Àk obs S
ð Þt
ð
ÞþF 1 ð8Þ
where k obs (F) and k obs (S) are the observed rate constants of the fast
and slow components, ΔF F and ΔF S are the associated amplitudes,
and F 1 is the final florescence value.
Calmodulin Target Interactions
95