

of the ground-truth pixels on the Landsat TM images were used for deriving rules for
the decision tree and another half for validating results. Because of the unavailability
of high-spatial-resolution images, the ground truth for the years 1998 and 2007 was
obtained through direct visual interpretation of Landsat TM images based on the
spectral and spatial patterns learned from the images of the year 2011. The Landsat
TM training pixels obtained from the ground truth in 1998, 2007, and 2011 were
purified by using n-Dimensional Visualizer in ENVI software to obtain the representative pixels for each land-cover type.
ENVI Decision Tree tool is used to implement the decision-tree classifier. The
classifier is used to classify the Landsat TM images for the study area. The results are
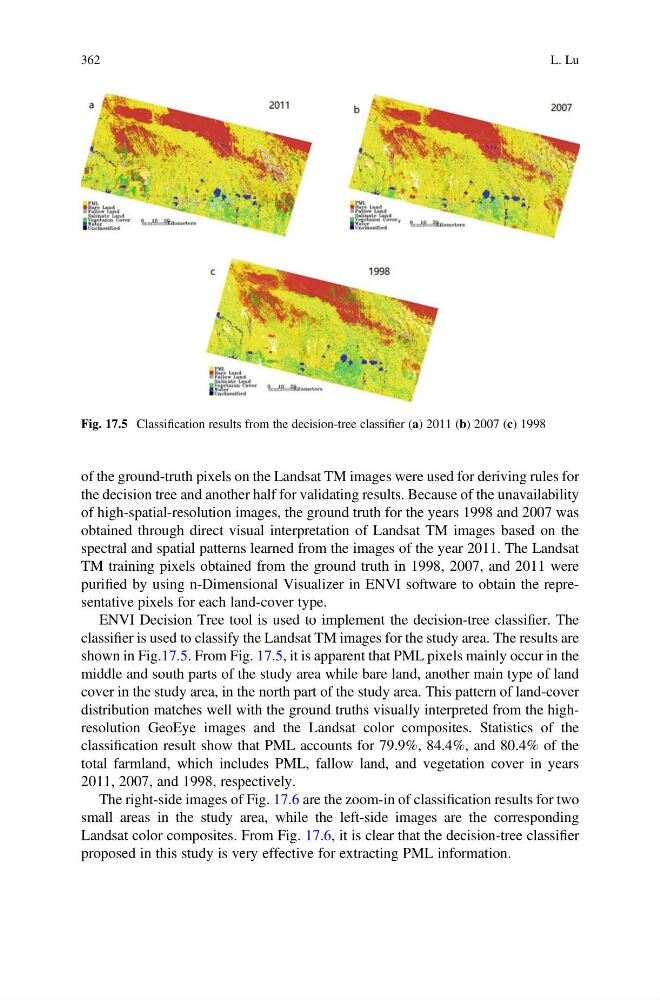
shown in Fig.17.5. From Fig. 17.5, it is apparent that PML pixels mainly occur in the
middle and south parts of the study area while bare land, another main type of land
cover in the study area, in the north part of the study area. This pattern of land-cover
distribution matches well with the ground truths visually interpreted from the highresolution GeoEye images and the Landsat color composites. Statistics of the
classification result show that PML accounts for 79.9%, 84.4%, and 80.4% of the
total farmland, which includes PML, fallow land, and vegetation cover in years
2011, 2007, and 1998, respectively.
The right-side images of Fig. 17.6 are the zoom-in of classification results for two
small areas in the study area, while the left-side images are the corresponding
Landsat color composites. From Fig. 17.6, it is clear that the decision-tree classifier
proposed in this study is very effective for extracting PML information.
Fig. 17.5 Classification results from the decision-tree classifier (a) 2011 (b) 2007 (c) 1998
362
L. Lu
the decision tree and another half for validating results. Because of the unavailability
of high-spatial-resolution images, the ground truth for the years 1998 and 2007 was
obtained through direct visual interpretation of Landsat TM images based on the
spectral and spatial patterns learned from the images of the year 2011. The Landsat
TM training pixels obtained from the ground truth in 1998, 2007, and 2011 were
purified by using n-Dimensional Visualizer in ENVI software to obtain the representative pixels for each land-cover type.
ENVI Decision Tree tool is used to implement the decision-tree classifier. The
classifier is used to classify the Landsat TM images for the study area. The results are
shown in Fig.17.5. From Fig. 17.5, it is apparent that PML pixels mainly occur in the
middle and south parts of the study area while bare land, another main type of land
cover in the study area, in the north part of the study area. This pattern of land-cover
distribution matches well with the ground truths visually interpreted from the highresolution GeoEye images and the Landsat color composites. Statistics of the
classification result show that PML accounts for 79.9%, 84.4%, and 80.4% of the
total farmland, which includes PML, fallow land, and vegetation cover in years
2011, 2007, and 1998, respectively.
The right-side images of Fig. 17.6 are the zoom-in of classification results for two
small areas in the study area, while the left-side images are the corresponding
Landsat color composites. From Fig. 17.6, it is clear that the decision-tree classifier
proposed in this study is very effective for extracting PML information.
Fig. 17.5 Classification results from the decision-tree classifier (a) 2011 (b) 2007 (c) 1998
362
L. Lu