

PML on corn. Therefore, we select high-quality Landsat TM images mainly in May
and some in late July and early August of 1998, 2007, and 2011 as the source data.
The use of Landsat images acquired in July and August is for distinguishing the bare
land and fallow land.
The Landsat TM data were downloaded from the U.S. Geological Survey
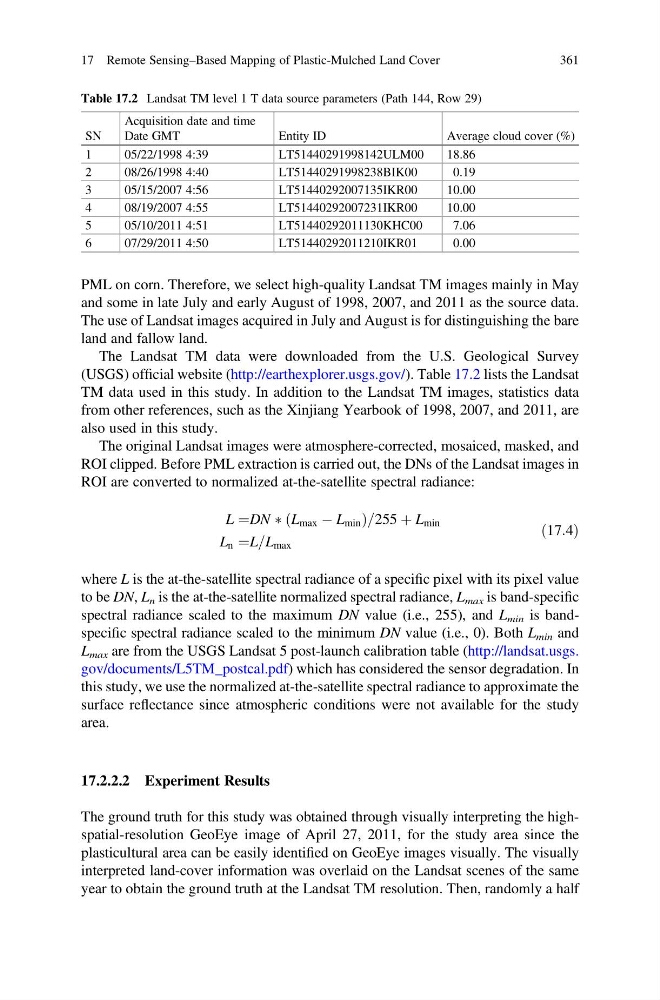
(USGS) official website (http://earthexplorer.usgs.gov/). Table 17.2 lists the Landsat
TM data used in this study. In addition to the Landsat TM images, statistics data
from other references, such as the Xinjiang Yearbook of 1998, 2007, and 2011, are
also used in this study.
The original Landsat images were atmosphere-corrected, mosaiced, masked, and
ROI clipped. Before PML extraction is carried out, the DNs of the Landsat images in
ROI are converted to normalized at-the-satellite spectral radiance:
L ¼DN Ã L max À L min
ð
Þ =255 þ L min
L n ¼L=L max
ð17:4Þ
where L is the at-the-satellite spectral radiance of a specific pixel with its pixel value
to be DN, L n is the at-the-satellite normalized spectral radiance, L max is band-specific
spectral radiance scaled to the maximum DN value (i.e., 255), and L min is bandspecific spectral radiance scaled to the minimum DN value (i.e., 0). Both L min and
L max are from the USGS Landsat 5 post-launch calibration table (http://landsat.usgs.
gov/documents/L5TM_postcal.pdf) which has considered the sensor degradation. In
this study, we use the normalized at-the-satellite spectral radiance to approximate the
surface reflectance since atmospheric conditions were not available for the study
area.
17.2.2.2 Experiment Results
The ground truth for this study was obtained through visually interpreting the highspatial-resolution GeoEye image of April 27, 2011, for the study area since the
plasticultural area can be easily identified on GeoEye images visually. The visually
interpreted land-cover information was overlaid on the Landsat scenes of the same
year to obtain the ground truth at the Landsat TM resolution. Then, randomly a half
Table 17.2 Landsat TM level 1 T data source parameters (Path 144, Row 29)
SN
Acquisition date and time
Date GMT
Entity ID
Average cloud cover (%)
1
05/22/1998 4:39
LT51440291998142ULM00
18.86
2
08/26/1998 4:40
LT51440291998238BIK00
0.19
3
05/15/2007 4:56
LT51440292007135IKR00
10.00
4
08/19/2007 4:55
LT51440292007231IKR00
10.00
5
05/10/2011 4:51
LT51440292011130KHC00
7.06
6
07/29/2011 4:50
LT51440292011210IKR01
0.00
17 Remote Sensing–Based Mapping of Plastic-Mulched Land Cover
361
and some in late July and early August of 1998, 2007, and 2011 as the source data.
The use of Landsat images acquired in July and August is for distinguishing the bare
land and fallow land.
The Landsat TM data were downloaded from the U.S. Geological Survey
(USGS) official website (http://earthexplorer.usgs.gov/). Table 17.2 lists the Landsat
TM data used in this study. In addition to the Landsat TM images, statistics data
from other references, such as the Xinjiang Yearbook of 1998, 2007, and 2011, are
also used in this study.
The original Landsat images were atmosphere-corrected, mosaiced, masked, and
ROI clipped. Before PML extraction is carried out, the DNs of the Landsat images in
ROI are converted to normalized at-the-satellite spectral radiance:
L ¼DN Ã L max À L min
ð
Þ =255 þ L min
L n ¼L=L max
ð17:4Þ
where L is the at-the-satellite spectral radiance of a specific pixel with its pixel value
to be DN, L n is the at-the-satellite normalized spectral radiance, L max is band-specific
spectral radiance scaled to the maximum DN value (i.e., 255), and L min is bandspecific spectral radiance scaled to the minimum DN value (i.e., 0). Both L min and
L max are from the USGS Landsat 5 post-launch calibration table (http://landsat.usgs.
gov/documents/L5TM_postcal.pdf) which has considered the sensor degradation. In
this study, we use the normalized at-the-satellite spectral radiance to approximate the
surface reflectance since atmospheric conditions were not available for the study
area.
17.2.2.2 Experiment Results
The ground truth for this study was obtained through visually interpreting the highspatial-resolution GeoEye image of April 27, 2011, for the study area since the
plasticultural area can be easily identified on GeoEye images visually. The visually
interpreted land-cover information was overlaid on the Landsat scenes of the same
year to obtain the ground truth at the Landsat TM resolution. Then, randomly a half
Table 17.2 Landsat TM level 1 T data source parameters (Path 144, Row 29)
SN
Acquisition date and time
Date GMT
Entity ID
Average cloud cover (%)
1
05/22/1998 4:39
LT51440291998142ULM00
18.86
2
08/26/1998 4:40
LT51440291998238BIK00
0.19
3
05/15/2007 4:56
LT51440292007135IKR00
10.00
4
08/19/2007 4:55
LT51440292007231IKR00
10.00
5
05/10/2011 4:51
LT51440292011130KHC00
7.06
6
07/29/2011 4:50
LT51440292011210IKR01
0.00
17 Remote Sensing–Based Mapping of Plastic-Mulched Land Cover
361