

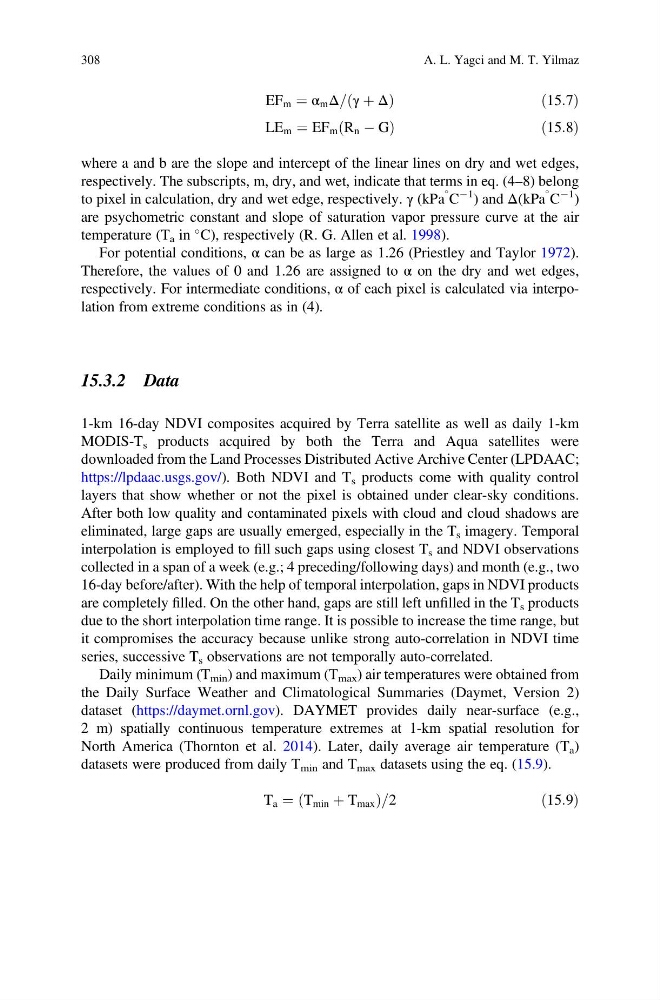
EF m ¼ α m Δ= γ þ Δ
ð
Þ
ð15:7Þ
LE m ¼ EF m R n À G
ð
Þ
ð15:8Þ
where a and b are the slope and intercept of the linear lines on dry and wet edges,
respectively. The subscripts, m, dry, and wet, indicate that terms in eq. (4–8) belong
to pixel in calculation, dry and wet edge, respectively. γ (kPa
C
À1 ) and Δ(kPa
C
À1 )
are psychometric constant and slope of saturation vapor pressure curve at the air
temperature (T a in
C), respectively (R. G. Allen et al. 1998).
For potential conditions, α can be as large as 1.26 (Priestley and Taylor 1972).
Therefore, the values of 0 and 1.26 are assigned to α on the dry and wet edges,
respectively. For intermediate conditions, α of each pixel is calculated via interpolation from extreme conditions as in (4).
15.3.2 Data
1-km 16-day NDVI composites acquired by Terra satellite as well as daily 1-km
MODIS-T s products acquired by both the Terra and Aqua satellites were
downloaded from the Land Processes Distributed Active Archive Center (LPDAAC;
https://lpdaac.usgs.gov/). Both NDVI and T s products come with quality control
layers that show whether or not the pixel is obtained under clear-sky conditions.
After both low quality and contaminated pixels with cloud and cloud shadows are
eliminated, large gaps are usually emerged, especially in the T s imagery. Temporal
interpolation is employed to fill such gaps using closest T s and NDVI observations
collected in a span of a week (e.g.; 4 preceding/following days) and month (e.g., two
16-day before/after). With the help of temporal interpolation, gaps in NDVI products
are completely filled. On the other hand, gaps are still left unfilled in the T s products
due to the short interpolation time range. It is possible to increase the time range, but
it compromises the accuracy because unlike strong auto-correlation in NDVI time
series, successive T s observations are not temporally auto-correlated.
Daily minimum (T min ) and maximum (T max ) air temperatures were obtained from
the Daily Surface Weather and Climatological Summaries (Daymet, Version 2)
dataset (https://daymet.ornl.gov). DAYMET provides daily near-surface (e.g.,
2 m) spatially continuous temperature extremes at 1-km spatial resolution for
North America (Thornton et al. 2014). Later, daily average air temperature (T a )
datasets were produced from daily T min and T max datasets using the eq. (15.9).
T a ¼ T min þ T max
ð
Þ =2
ð15:9Þ
308
A. L. Yagci and M. T. Yilmaz
ð
Þ
ð15:7Þ
LE m ¼ EF m R n À G
ð
Þ
ð15:8Þ
where a and b are the slope and intercept of the linear lines on dry and wet edges,
respectively. The subscripts, m, dry, and wet, indicate that terms in eq. (4–8) belong
to pixel in calculation, dry and wet edge, respectively. γ (kPa
C
À1 ) and Δ(kPa
C
À1 )
are psychometric constant and slope of saturation vapor pressure curve at the air
temperature (T a in
C), respectively (R. G. Allen et al. 1998).
For potential conditions, α can be as large as 1.26 (Priestley and Taylor 1972).
Therefore, the values of 0 and 1.26 are assigned to α on the dry and wet edges,
respectively. For intermediate conditions, α of each pixel is calculated via interpolation from extreme conditions as in (4).
15.3.2 Data
1-km 16-day NDVI composites acquired by Terra satellite as well as daily 1-km
MODIS-T s products acquired by both the Terra and Aqua satellites were
downloaded from the Land Processes Distributed Active Archive Center (LPDAAC;
https://lpdaac.usgs.gov/). Both NDVI and T s products come with quality control
layers that show whether or not the pixel is obtained under clear-sky conditions.
After both low quality and contaminated pixels with cloud and cloud shadows are
eliminated, large gaps are usually emerged, especially in the T s imagery. Temporal
interpolation is employed to fill such gaps using closest T s and NDVI observations
collected in a span of a week (e.g.; 4 preceding/following days) and month (e.g., two
16-day before/after). With the help of temporal interpolation, gaps in NDVI products
are completely filled. On the other hand, gaps are still left unfilled in the T s products
due to the short interpolation time range. It is possible to increase the time range, but
it compromises the accuracy because unlike strong auto-correlation in NDVI time
series, successive T s observations are not temporally auto-correlated.
Daily minimum (T min ) and maximum (T max ) air temperatures were obtained from
the Daily Surface Weather and Climatological Summaries (Daymet, Version 2)
dataset (https://daymet.ornl.gov). DAYMET provides daily near-surface (e.g.,
2 m) spatially continuous temperature extremes at 1-km spatial resolution for
North America (Thornton et al. 2014). Later, daily average air temperature (T a )
datasets were produced from daily T min and T max datasets using the eq. (15.9).
T a ¼ T min þ T max
ð
Þ =2
ð15:9Þ
308
A. L. Yagci and M. T. Yilmaz