

T s À T a
ð
Þ wet ¼ NDVI m À b wet
ð
Þ =a wet
ð15:4Þ
T s À T a
ð
Þ dry ¼ NDVI m À b dry
À
Á =a dry
ð15:5Þ
α m ¼ T s À T a
ð
Þ dry À T s À T a
ð
Þ m
h
i
= T s À T a
ð
Þ dry À T s À T a
ð
Þ wet
h
i
ð15:6Þ
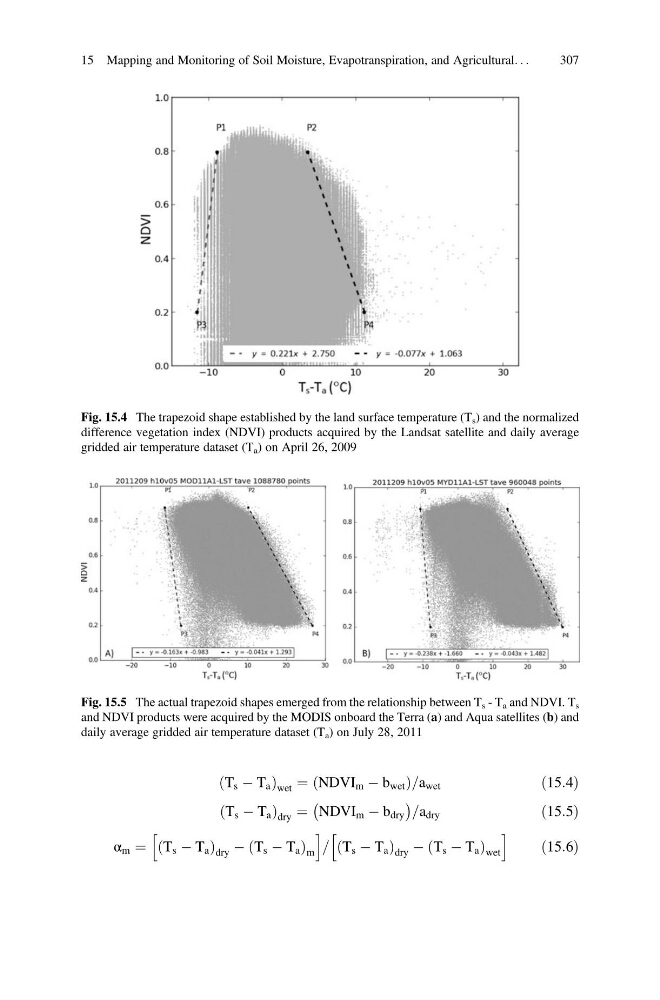
Fig. 15.4 The trapezoid shape established by the land surface temperature (T s ) and the normalized
difference vegetation index (NDVI) products acquired by the Landsat satellite and daily average
gridded air temperature dataset (T a ) on April 26, 2009
Fig. 15.5 The actual trapezoid shapes emerged from the relationship between T s - T a and NDVI. T s
and NDVI products were acquired by the MODIS onboard the Terra (a) and Aqua satellites (b) and
daily average gridded air temperature dataset (T a ) on July 28, 2011
15 Mapping and Monitoring of Soil Moisture, Evapotranspiration, and Agricultural. . .
307
ð
Þ wet ¼ NDVI m À b wet
ð
Þ =a wet
ð15:4Þ
T s À T a
ð
Þ dry ¼ NDVI m À b dry
À
Á =a dry
ð15:5Þ
α m ¼ T s À T a
ð
Þ dry À T s À T a
ð
Þ m
h
i
= T s À T a
ð
Þ dry À T s À T a
ð
Þ wet
h
i
ð15:6Þ
Fig. 15.4 The trapezoid shape established by the land surface temperature (T s ) and the normalized
difference vegetation index (NDVI) products acquired by the Landsat satellite and daily average
gridded air temperature dataset (T a ) on April 26, 2009
Fig. 15.5 The actual trapezoid shapes emerged from the relationship between T s - T a and NDVI. T s
and NDVI products were acquired by the MODIS onboard the Terra (a) and Aqua satellites (b) and
daily average gridded air temperature dataset (T a ) on July 28, 2011
15 Mapping and Monitoring of Soil Moisture, Evapotranspiration, and Agricultural. . .
307