

15.3.1 Methods
Land surface temperature (T s ) is a critical variable which can be used to diagnose
surface moisture and ET status without the knowledge of a priori information such as
antecedent precipitation amount and initial ground and surface conditions
(M. C. Anderson and Kustas 2008). In contrast to vegetation greenness in Normalized Difference Vegetation Index (NDVI) units, LST responds rapidly to the
changes in soil moisture and subsequently ET rate. The difference between Land
surface temperature and daily average air temperature (T s -T a ) was found to be a
robust indicator of plant moisture status (Jackson et al. 1981) when T a is measured at
a common reference height (Gardner et al. 1981). Later, Moran et al. (1994)
demonstrated with in situ measurements that a trapezoidal shape emerges in a
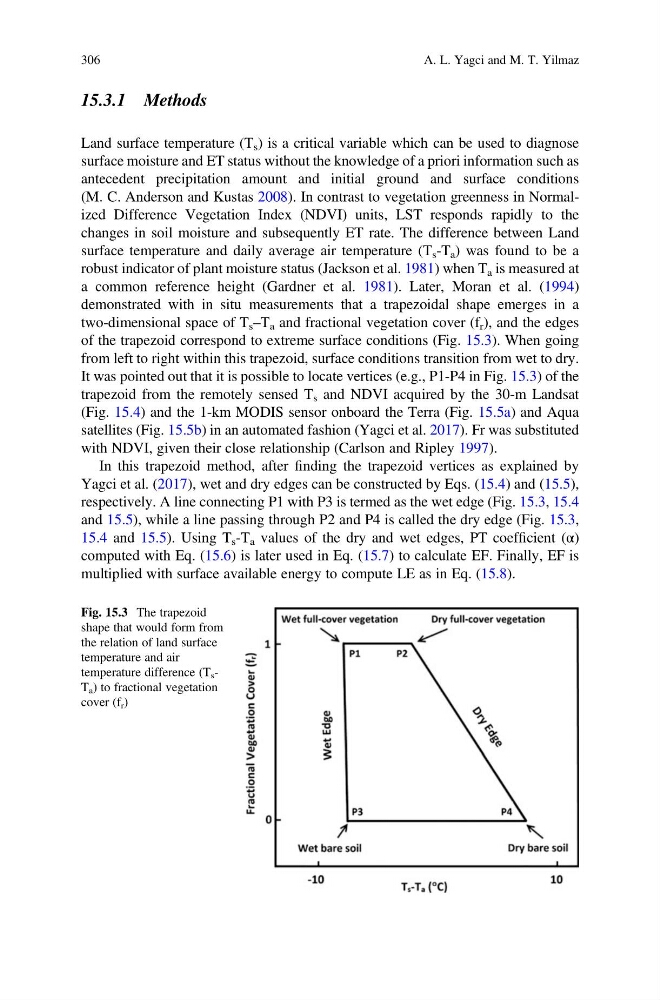
two-dimensional space of T s –T a and fractional vegetation cover (f r ), and the edges
of the trapezoid correspond to extreme surface conditions (Fig. 15.3). When going
from left to right within this trapezoid, surface conditions transition from wet to dry.
It was pointed out that it is possible to locate vertices (e.g., P1-P4 in Fig. 15.3) of the
trapezoid from the remotely sensed T s and NDVI acquired by the 30-m Landsat
(Fig. 15.4) and the 1-km MODIS sensor onboard the Terra (Fig. 15.5a) and Aqua
satellites (Fig. 15.5b) in an automated fashion (Yagci et al. 2017). Fr was substituted
with NDVI, given their close relationship (Carlson and Ripley 1997).
In this trapezoid method, after finding the trapezoid vertices as explained by
Yagci et al. (2017), wet and dry edges can be constructed by Eqs. (15.4) and (15.5),
respectively. A line connecting P1 with P3 is termed as the wet edge (Fig. 15.3, 15.4
and 15.5), while a line passing through P2 and P4 is called the dry edge (Fig. 15.3,
15.4 and 15.5). Using T s -T a values of the dry and wet edges, PT coefficient (α)
computed with Eq. (15.6) is later used in Eq. (15.7) to calculate EF. Finally, EF is
multiplied with surface available energy to compute LE as in Eq. (15.8).
Fig. 15.3 The trapezoid
shape that would form from
the relation of land surface
temperature and air
temperature difference (T s -
T a ) to fractional vegetation
cover (f r )
306
A. L. Yagci and M. T. Yilmaz
Land surface temperature (T s ) is a critical variable which can be used to diagnose
surface moisture and ET status without the knowledge of a priori information such as
antecedent precipitation amount and initial ground and surface conditions
(M. C. Anderson and Kustas 2008). In contrast to vegetation greenness in Normalized Difference Vegetation Index (NDVI) units, LST responds rapidly to the
changes in soil moisture and subsequently ET rate. The difference between Land
surface temperature and daily average air temperature (T s -T a ) was found to be a
robust indicator of plant moisture status (Jackson et al. 1981) when T a is measured at
a common reference height (Gardner et al. 1981). Later, Moran et al. (1994)
demonstrated with in situ measurements that a trapezoidal shape emerges in a
two-dimensional space of T s –T a and fractional vegetation cover (f r ), and the edges
of the trapezoid correspond to extreme surface conditions (Fig. 15.3). When going
from left to right within this trapezoid, surface conditions transition from wet to dry.
It was pointed out that it is possible to locate vertices (e.g., P1-P4 in Fig. 15.3) of the
trapezoid from the remotely sensed T s and NDVI acquired by the 30-m Landsat
(Fig. 15.4) and the 1-km MODIS sensor onboard the Terra (Fig. 15.5a) and Aqua
satellites (Fig. 15.5b) in an automated fashion (Yagci et al. 2017). Fr was substituted
with NDVI, given their close relationship (Carlson and Ripley 1997).
In this trapezoid method, after finding the trapezoid vertices as explained by
Yagci et al. (2017), wet and dry edges can be constructed by Eqs. (15.4) and (15.5),
respectively. A line connecting P1 with P3 is termed as the wet edge (Fig. 15.3, 15.4
and 15.5), while a line passing through P2 and P4 is called the dry edge (Fig. 15.3,
15.4 and 15.5). Using T s -T a values of the dry and wet edges, PT coefficient (α)
computed with Eq. (15.6) is later used in Eq. (15.7) to calculate EF. Finally, EF is
multiplied with surface available energy to compute LE as in Eq. (15.8).
Fig. 15.3 The trapezoid
shape that would form from
the relation of land surface
temperature and air
temperature difference (T s -
T a ) to fractional vegetation
cover (f r )
306
A. L. Yagci and M. T. Yilmaz