

as a fourth soil moisture product, and the cross-correlation between these four
products are evaluated over each pixel separately. The highest cross-correlation
against other products is considered to have a higher common soil moisture signal
that is thought to be present. The location of the products whose average correlation
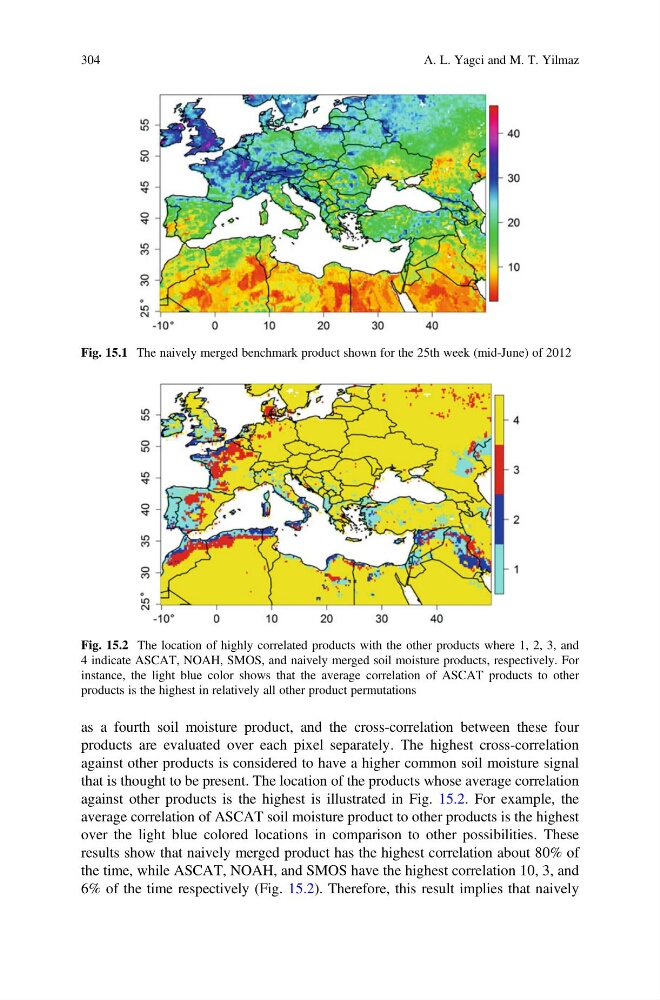
against other products is the highest is illustrated in Fig. 15.2. For example, the
average correlation of ASCAT soil moisture product to other products is the highest
over the light blue colored locations in comparison to other possibilities. These
results show that naively merged product has the highest correlation about 80% of
the time, while ASCAT, NOAH, and SMOS have the highest correlation 10, 3, and
6% of the time respectively (Fig. 15.2). Therefore, this result implies that naively
Fig. 15.1 The naively merged benchmark product shown for the 25th week (mid-June) of 2012
Fig. 15.2 The location of highly correlated products with the other products where 1, 2, 3, and
4 indicate ASCAT, NOAH, SMOS, and naively merged soil moisture products, respectively. For
instance, the light blue color shows that the average correlation of ASCAT products to other
products is the highest in relatively all other product permutations
304
A. L. Yagci and M. T. Yilmaz
products are evaluated over each pixel separately. The highest cross-correlation
against other products is considered to have a higher common soil moisture signal
that is thought to be present. The location of the products whose average correlation
against other products is the highest is illustrated in Fig. 15.2. For example, the
average correlation of ASCAT soil moisture product to other products is the highest
over the light blue colored locations in comparison to other possibilities. These
results show that naively merged product has the highest correlation about 80% of
the time, while ASCAT, NOAH, and SMOS have the highest correlation 10, 3, and
6% of the time respectively (Fig. 15.2). Therefore, this result implies that naively
Fig. 15.1 The naively merged benchmark product shown for the 25th week (mid-June) of 2012
Fig. 15.2 The location of highly correlated products with the other products where 1, 2, 3, and
4 indicate ASCAT, NOAH, SMOS, and naively merged soil moisture products, respectively. For
instance, the light blue color shows that the average correlation of ASCAT products to other
products is the highest in relatively all other product permutations
304
A. L. Yagci and M. T. Yilmaz