

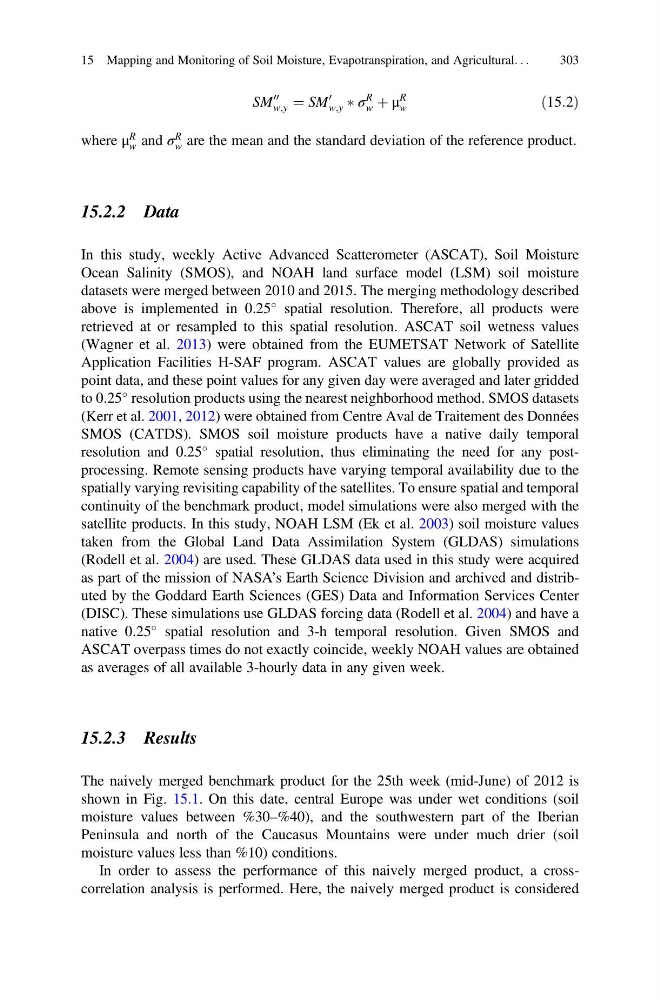
SM
00
w,y ¼ SM
0
w,y à σ
R
w þ μ
R
w
ð15:2Þ
where μ
R
w and σ
R
w are the mean and the standard deviation of the reference product.
15.2.2 Data
In this study, weekly Active Advanced Scatterometer (ASCAT), Soil Moisture
Ocean Salinity (SMOS), and NOAH land surface model (LSM) soil moisture
datasets were merged between 2010 and 2015. The merging methodology described
above is implemented in 0.25
spatial resolution. Therefore, all products were
retrieved at or resampled to this spatial resolution. ASCAT soil wetness values
(Wagner et al. 2013) were obtained from the EUMETSAT Network of Satellite
Application Facilities H-SAF program. ASCAT values are globally provided as
point data, and these point values for any given day were averaged and later gridded
to 0.25
resolution products using the nearest neighborhood method. SMOS datasets
(Kerr et al. 2001, 2012) were obtained from Centre Aval de Traitement des Données
SMOS (CATDS). SMOS soil moisture products have a native daily temporal
resolution and 0.25
spatial resolution, thus eliminating the need for any postprocessing. Remote sensing products have varying temporal availability due to the
spatially varying revisiting capability of the satellites. To ensure spatial and temporal
continuity of the benchmark product, model simulations were also merged with the
satellite products. In this study, NOAH LSM (Ek et al. 2003) soil moisture values
taken from the Global Land Data Assimilation System (GLDAS) simulations
(Rodell et al. 2004) are used. These GLDAS data used in this study were acquired
as part of the mission of NASA’s Earth Science Division and archived and distributed by the Goddard Earth Sciences (GES) Data and Information Services Center
(DISC). These simulations use GLDAS forcing data (Rodell et al. 2004) and have a
native 0.25
spatial resolution and 3-h temporal resolution. Given SMOS and
ASCAT overpass times do not exactly coincide, weekly NOAH values are obtained
as averages of all available 3-hourly data in any given week.
15.2.3 Results
The naively merged benchmark product for the 25th week (mid-June) of 2012 is
shown in Fig. 15.1. On this date, central Europe was under wet conditions (soil
moisture values between %30–%40), and the southwestern part of the Iberian
Peninsula and north of the Caucasus Mountains were under much drier (soil
moisture values less than %10) conditions.
In order to assess the performance of this naively merged product, a crosscorrelation analysis is performed. Here, the naively merged product is considered
15 Mapping and Monitoring of Soil Moisture, Evapotranspiration, and Agricultural. . .
303
00
w,y ¼ SM
0
w,y à σ
R
w þ μ
R
w
ð15:2Þ
where μ
R
w and σ
R
w are the mean and the standard deviation of the reference product.
15.2.2 Data
In this study, weekly Active Advanced Scatterometer (ASCAT), Soil Moisture
Ocean Salinity (SMOS), and NOAH land surface model (LSM) soil moisture
datasets were merged between 2010 and 2015. The merging methodology described
above is implemented in 0.25
spatial resolution. Therefore, all products were
retrieved at or resampled to this spatial resolution. ASCAT soil wetness values
(Wagner et al. 2013) were obtained from the EUMETSAT Network of Satellite
Application Facilities H-SAF program. ASCAT values are globally provided as
point data, and these point values for any given day were averaged and later gridded
to 0.25
resolution products using the nearest neighborhood method. SMOS datasets
(Kerr et al. 2001, 2012) were obtained from Centre Aval de Traitement des Données
SMOS (CATDS). SMOS soil moisture products have a native daily temporal
resolution and 0.25
spatial resolution, thus eliminating the need for any postprocessing. Remote sensing products have varying temporal availability due to the
spatially varying revisiting capability of the satellites. To ensure spatial and temporal
continuity of the benchmark product, model simulations were also merged with the
satellite products. In this study, NOAH LSM (Ek et al. 2003) soil moisture values
taken from the Global Land Data Assimilation System (GLDAS) simulations
(Rodell et al. 2004) are used. These GLDAS data used in this study were acquired
as part of the mission of NASA’s Earth Science Division and archived and distributed by the Goddard Earth Sciences (GES) Data and Information Services Center
(DISC). These simulations use GLDAS forcing data (Rodell et al. 2004) and have a
native 0.25
spatial resolution and 3-h temporal resolution. Given SMOS and
ASCAT overpass times do not exactly coincide, weekly NOAH values are obtained
as averages of all available 3-hourly data in any given week.
15.2.3 Results
The naively merged benchmark product for the 25th week (mid-June) of 2012 is
shown in Fig. 15.1. On this date, central Europe was under wet conditions (soil
moisture values between %30–%40), and the southwestern part of the Iberian
Peninsula and north of the Caucasus Mountains were under much drier (soil
moisture values less than %10) conditions.
In order to assess the performance of this naively merged product, a crosscorrelation analysis is performed. Here, the naively merged product is considered
15 Mapping and Monitoring of Soil Moisture, Evapotranspiration, and Agricultural. . .
303