

As shown in Table 14.4, the resulting accuracies indicate that the automatic
stratification method generally results in higher accuracies, but these results do not
indicate whether the differences in these two methods are significant statistically.
The ultimate goal of this evaluation is to determine whether the automated stratification method achieves equivalent or improved accuracies when compared to the
traditional (visual interpretation) stratification method. Therefore, two-tailed proportion tests, a chi-square test or a Fisher’s exact test for sample sizes less than five is
conducted for each state and each stratum. In these tests, it is assumed that p 1 and p 2
represent the accuracy results from the traditional stratification method and from the
proposed automated stratification method, respectively. The hypotheses of the
significance tests are H 0 : p 1 ¼ p 2 and Ha: p 1 6 ¼ p 2 . The null hypothesis stated that
there was no difference in the accuracies of the two stratification methods while the
alternative hypothesis stated that the accuracies of the two stratification methods
were significantly different. The tests are to be performed for each state and each
stratum with a confidence level of 95% or significance level of 0.05. The null
hypothesis was rejected if the p-value was less than 0.05.
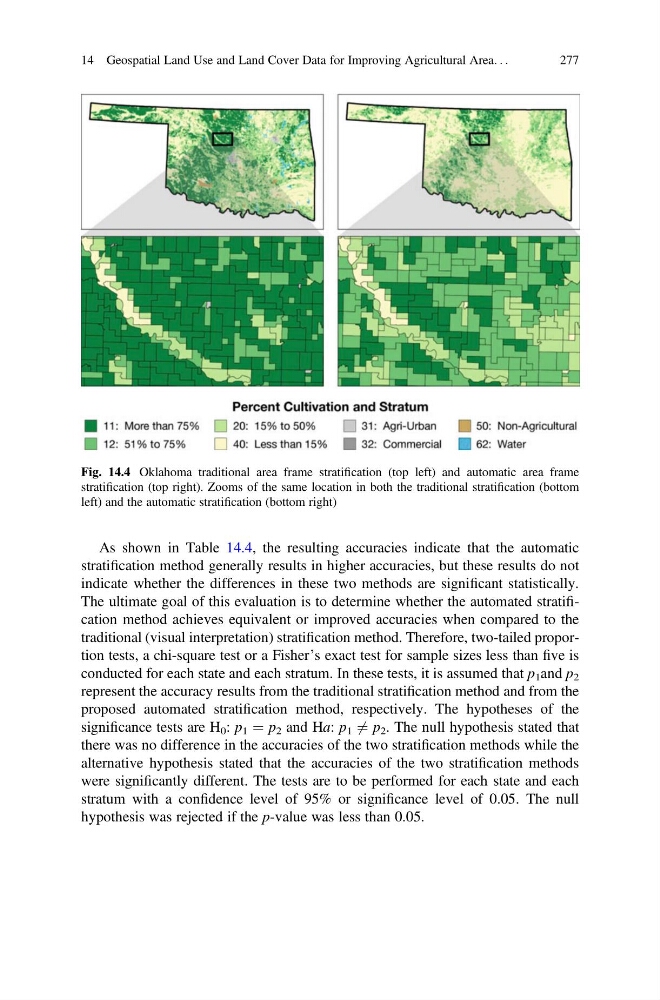
Fig. 14.4 Oklahoma traditional area frame stratification (top left) and automatic area frame
stratification (top right). Zooms of the same location in both the traditional stratification (bottom
left) and the automatic stratification (bottom right)
14 Geospatial Land Use and Land Cover Data for Improving Agricultural Area. . .
277
stratification method generally results in higher accuracies, but these results do not
indicate whether the differences in these two methods are significant statistically.
The ultimate goal of this evaluation is to determine whether the automated stratification method achieves equivalent or improved accuracies when compared to the
traditional (visual interpretation) stratification method. Therefore, two-tailed proportion tests, a chi-square test or a Fisher’s exact test for sample sizes less than five is
conducted for each state and each stratum. In these tests, it is assumed that p 1 and p 2
represent the accuracy results from the traditional stratification method and from the
proposed automated stratification method, respectively. The hypotheses of the
significance tests are H 0 : p 1 ¼ p 2 and Ha: p 1 6 ¼ p 2 . The null hypothesis stated that
there was no difference in the accuracies of the two stratification methods while the
alternative hypothesis stated that the accuracies of the two stratification methods
were significantly different. The tests are to be performed for each state and each
stratum with a confidence level of 95% or significance level of 0.05. The null
hypothesis was rejected if the p-value was less than 0.05.
Fig. 14.4 Oklahoma traditional area frame stratification (top left) and automatic area frame
stratification (top right). Zooms of the same location in both the traditional stratification (bottom
left) and the automatic stratification (bottom right)
14 Geospatial Land Use and Land Cover Data for Improving Agricultural Area. . .
277