

14.4.2 Automatic Stratification Analysis and Results
Evaluation
Figures 14.4, 14.5, 14.6, 14.7 and 14.8 illustrate the traditional and automated area
frame stratifications for the five states in this study. In four states, the traditional
stratification method, based on visual interpretation, identifies a larger number of
PSUs as having more cultivation than the automated stratification method. Particularly in Oklahoma (Fig. 14.4), the traditional stratification method identifies extensive areas as greater than 75% cultivation (dark green), while the automated
stratification method identifies significantly less cultivation (light green and tan).
Arizona (Fig. 14.7) is the only example in which higher percentages of cultivation
are identified in more PSUs using the automatic stratification method.
.
While Figures 14.4, 14.5, 14.6, 14.7 and 14.8 illustrate large differences between
traditional and automatic stratification in the five test states, to evaluate the effectiveness of the automatic stratification method, the results are compared with those
of the traditional stratification method based on 2010 JAS segment ground reference
data. Stratification performance or “accuracy” is assessed based on the percent of the
sampled and enumerated JAS segments that match the definition of the PSUs within
which they were selected. During the JAS, field enumerators recorded crop and
non-crop acreage for all selected segments. JAS segment stratum definitions (percent
cultivation) are calculated directly from the reported segment data. Only selected
JAS segments are enumerated. The remaining segments in the selected PSUs are not
enumerated in the JAS due to cost limitations. Due to the fact that not all segments in
the selected PSUs are enumerated, the validation is conducted based on the enumerated segment data, which are the only available ground reference data. It is a goal
that a high percentage of the sample segments match the stratum definitions of the
PSUs from which they were selected. Therefore, it is assumed that enumerated
segments reflected the originating PSU stratum definitions. Both the traditional
and automated stratification methods are evaluated in the same manner.
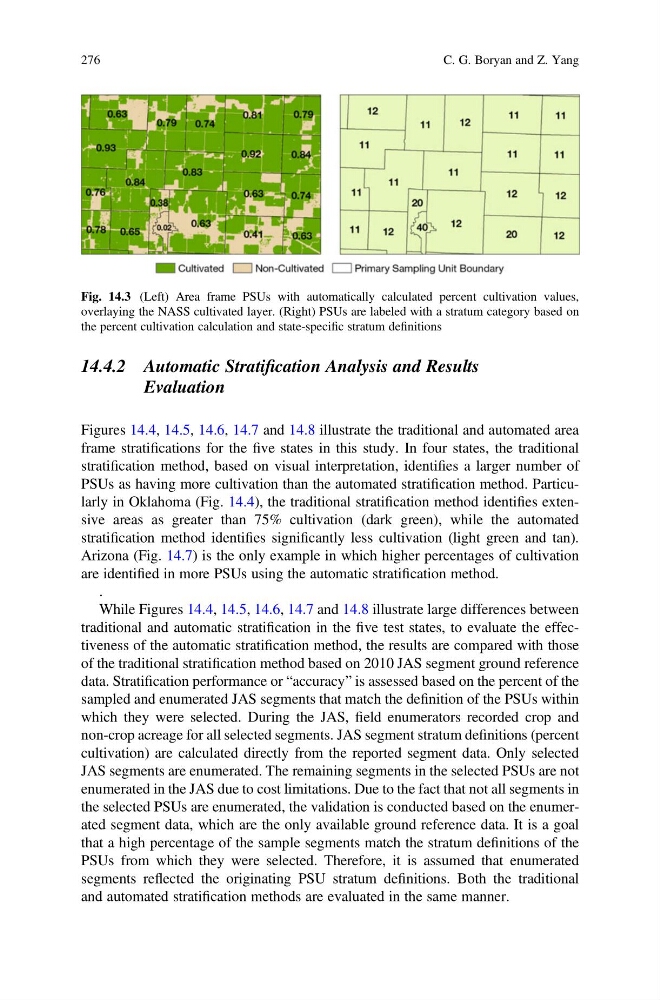
Fig. 14.3 (Left) Area frame PSUs with automatically calculated percent cultivation values,
overlaying the NASS cultivated layer. (Right) PSUs are labeled with a stratum category based on
the percent cultivation calculation and state-specific stratum definitions
276
C. G. Boryan and Z. Yang
Evaluation
Figures 14.4, 14.5, 14.6, 14.7 and 14.8 illustrate the traditional and automated area
frame stratifications for the five states in this study. In four states, the traditional
stratification method, based on visual interpretation, identifies a larger number of
PSUs as having more cultivation than the automated stratification method. Particularly in Oklahoma (Fig. 14.4), the traditional stratification method identifies extensive areas as greater than 75% cultivation (dark green), while the automated
stratification method identifies significantly less cultivation (light green and tan).
Arizona (Fig. 14.7) is the only example in which higher percentages of cultivation
are identified in more PSUs using the automatic stratification method.
.
While Figures 14.4, 14.5, 14.6, 14.7 and 14.8 illustrate large differences between
traditional and automatic stratification in the five test states, to evaluate the effectiveness of the automatic stratification method, the results are compared with those
of the traditional stratification method based on 2010 JAS segment ground reference
data. Stratification performance or “accuracy” is assessed based on the percent of the
sampled and enumerated JAS segments that match the definition of the PSUs within
which they were selected. During the JAS, field enumerators recorded crop and
non-crop acreage for all selected segments. JAS segment stratum definitions (percent
cultivation) are calculated directly from the reported segment data. Only selected
JAS segments are enumerated. The remaining segments in the selected PSUs are not
enumerated in the JAS due to cost limitations. Due to the fact that not all segments in
the selected PSUs are enumerated, the validation is conducted based on the enumerated segment data, which are the only available ground reference data. It is a goal
that a high percentage of the sample segments match the stratum definitions of the
PSUs from which they were selected. Therefore, it is assumed that enumerated
segments reflected the originating PSU stratum definitions. Both the traditional
and automated stratification methods are evaluated in the same manner.
Fig. 14.3 (Left) Area frame PSUs with automatically calculated percent cultivation values,
overlaying the NASS cultivated layer. (Right) PSUs are labeled with a stratum category based on
the percent cultivation calculation and state-specific stratum definitions
276
C. G. Boryan and Z. Yang