

cannot be evenly divided into homogeneous segments. Second, boundary and
population changes occur over time that require manual editing, thus enabling the
area frame to more accurately reflect current conditions. Third, although the CDLs
are highly accurate (85–95% for major crops in large production states) (Boryan
et al. 2011), local areas can be impacted by CDL errors of omission and commission,
which can be identified and accounted for through manual inspection, particularly in
low cultivation areas.
14.2.3 NASS Cropland Data Layer
The NASS geospatial CDLs are annually updated 30–56-meter raster-formatted,
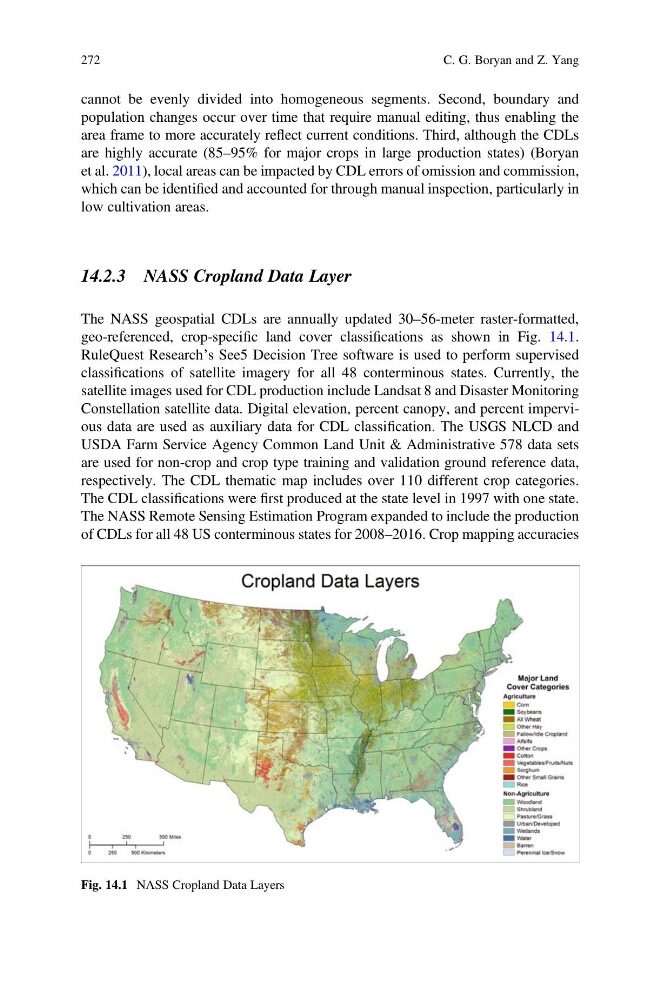
geo-referenced, crop-specific land cover classifications as shown in Fig. 14.1.
RuleQuest Research’s See5 Decision Tree software is used to perform supervised
classifications of satellite imagery for all 48 conterminous states. Currently, the
satellite images used for CDL production include Landsat 8 and Disaster Monitoring
Constellation satellite data. Digital elevation, percent canopy, and percent impervious data are used as auxiliary data for CDL classification. The USGS NLCD and
USDA Farm Service Agency Common Land Unit & Administrative 578 data sets
are used for non-crop and crop type training and validation ground reference data,
respectively. The CDL thematic map includes over 110 different crop categories.
The CDL classifications were first produced at the state level in 1997 with one state.
The NASS Remote Sensing Estimation Program expanded to include the production
of CDLs for all 48 US conterminous states for 2008–2016. Crop mapping accuracies
Fig. 14.1 NASS Cropland Data Layers
272
C. G. Boryan and Z. Yang
population changes occur over time that require manual editing, thus enabling the
area frame to more accurately reflect current conditions. Third, although the CDLs
are highly accurate (85–95% for major crops in large production states) (Boryan
et al. 2011), local areas can be impacted by CDL errors of omission and commission,
which can be identified and accounted for through manual inspection, particularly in
low cultivation areas.
14.2.3 NASS Cropland Data Layer
The NASS geospatial CDLs are annually updated 30–56-meter raster-formatted,
geo-referenced, crop-specific land cover classifications as shown in Fig. 14.1.
RuleQuest Research’s See5 Decision Tree software is used to perform supervised
classifications of satellite imagery for all 48 conterminous states. Currently, the
satellite images used for CDL production include Landsat 8 and Disaster Monitoring
Constellation satellite data. Digital elevation, percent canopy, and percent impervious data are used as auxiliary data for CDL classification. The USGS NLCD and
USDA Farm Service Agency Common Land Unit & Administrative 578 data sets
are used for non-crop and crop type training and validation ground reference data,
respectively. The CDL thematic map includes over 110 different crop categories.
The CDL classifications were first produced at the state level in 1997 with one state.
The NASS Remote Sensing Estimation Program expanded to include the production
of CDLs for all 48 US conterminous states for 2008–2016. Crop mapping accuracies
Fig. 14.1 NASS Cropland Data Layers
272
C. G. Boryan and Z. Yang