

for major crops in large production states, in historic CDLs, range from 85–95%
(Boryan et al. 2011; USDA NASS 2017a). The 1997–2016 archive of CDL is
publicly available from NASS’s online geospatial application – CropScape (Han
et al. 2012).
14.2.4 NASS Cultivated Layer
The CDLs provide the unique opportunity to use annually produced and highly
accurate crop-specific geospatial data for automated area frame stratification. State
and national scale 30 m raster cultivated land cover information can be derived from
the NASS CDLs. For operational purposes, five years of CDLs are combined to
create a national scale “Cultivated Layer”, which can be applied directly for area
frame stratification. The methodology used to create the NASS Cultivated Layers is
outlined in (Boryan et al., 2012). The NASS Cultivated Layer is a highly accurate
characterization of cultivated land across the 48 states in the conterminous
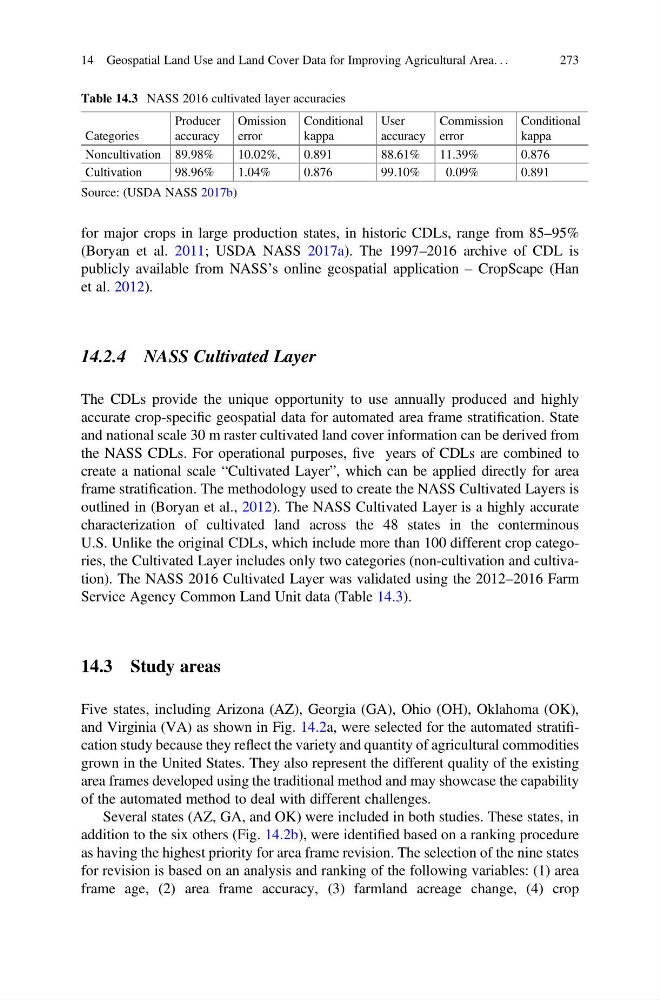
U.S. Unlike the original CDLs, which include more than 100 different crop categories, the Cultivated Layer includes only two categories (non-cultivation and cultivation). The NASS 2016 Cultivated Layer was validated using the 2012–2016 Farm
Service Agency Common Land Unit data (Table 14.3).
14.3 Study areas
Five states, including Arizona (AZ), Georgia (GA), Ohio (OH), Oklahoma (OK),
and Virginia (VA) as shown in Fig. 14.2a, were selected for the automated stratification study because they reflect the variety and quantity of agricultural commodities
grown in the United States. They also represent the different quality of the existing
area frames developed using the traditional method and may showcase the capability
of the automated method to deal with different challenges.
Several states (AZ, GA, and OK) were included in both studies. These states, in
addition to the six others (Fig. 14.2b), were identified based on a ranking procedure
as having the highest priority for area frame revision. The selection of the nine states
for revision is based on an analysis and ranking of the following variables: (1) area
frame age, (2) area frame accuracy, (3) farmland acreage change, (4) crop
Table 14.3 NASS 2016 cultivated layer accuracies
Categories
Producer
accuracy
Omission
error
Conditional
kappa
User
accuracy
Commission
error
Conditional
kappa
Noncultivation 89.98%
10.02%,
0.891
88.61%
11.39%
0.876
Cultivation
98.96%
1.04%
0.876
99.10%
0.09%
0.891
Source: (USDA NASS 2017b)
14 Geospatial Land Use and Land Cover Data for Improving Agricultural Area. . .
273
(Boryan et al. 2011; USDA NASS 2017a). The 1997–2016 archive of CDL is
publicly available from NASS’s online geospatial application – CropScape (Han
et al. 2012).
14.2.4 NASS Cultivated Layer
The CDLs provide the unique opportunity to use annually produced and highly
accurate crop-specific geospatial data for automated area frame stratification. State
and national scale 30 m raster cultivated land cover information can be derived from
the NASS CDLs. For operational purposes, five years of CDLs are combined to
create a national scale “Cultivated Layer”, which can be applied directly for area
frame stratification. The methodology used to create the NASS Cultivated Layers is
outlined in (Boryan et al., 2012). The NASS Cultivated Layer is a highly accurate
characterization of cultivated land across the 48 states in the conterminous
U.S. Unlike the original CDLs, which include more than 100 different crop categories, the Cultivated Layer includes only two categories (non-cultivation and cultivation). The NASS 2016 Cultivated Layer was validated using the 2012–2016 Farm
Service Agency Common Land Unit data (Table 14.3).
14.3 Study areas
Five states, including Arizona (AZ), Georgia (GA), Ohio (OH), Oklahoma (OK),
and Virginia (VA) as shown in Fig. 14.2a, were selected for the automated stratification study because they reflect the variety and quantity of agricultural commodities
grown in the United States. They also represent the different quality of the existing
area frames developed using the traditional method and may showcase the capability
of the automated method to deal with different challenges.
Several states (AZ, GA, and OK) were included in both studies. These states, in
addition to the six others (Fig. 14.2b), were identified based on a ranking procedure
as having the highest priority for area frame revision. The selection of the nine states
for revision is based on an analysis and ranking of the following variables: (1) area
frame age, (2) area frame accuracy, (3) farmland acreage change, (4) crop
Table 14.3 NASS 2016 cultivated layer accuracies
Categories
Producer
accuracy
Omission
error
Conditional
kappa
User
accuracy
Commission
error
Conditional
kappa
Noncultivation 89.98%
10.02%,
0.891
88.61%
11.39%
0.876
Cultivation
98.96%
1.04%
0.876
99.10%
0.09%
0.891
Source: (USDA NASS 2017b)
14 Geospatial Land Use and Land Cover Data for Improving Agricultural Area. . .
273