

Landsat data have been geometrically registered, radiometrically calibrated, and
atmospherically corrected to surface reflectance (Roy et al. 2014). Landsat surface
reflectance data product is a level-2 product in the Collection 1 and 2 process
(Vermote et al. 2016). Users can order data from EarthExplorer (https://
earthexplorer.usgs.gov/). The global Landsat data are saved in the Worldwide
Reference System (WRS)-2. The area and image size for a WRS-2 Landsat scene
acquired from different dates are slightly different. Landsat imagery in WRS-2 uses
UTM map projection. Since the centers of the two adjacent scenes may be in
different UTM zones, the overlapped area from neighbor paths may not be overlaid
for time series analysis without first doing map reprojection. To make data
processing easier, Landsat Analysis Ready Data (ARD) over the conterminous
United States (CONUS), Alaska, and Hawaii have been produced (available from
EarthExplorer). The ARD products use the fixed grid (or tile) and map projection to
store Landsat images. All images are processed in the Albers equal-area (AEA) conic
map projection. Each ARD tile includes 5000 x 5000 30-m pixels. It contains all the
pixels acquired within its extents. The ARD is intended to make it easier for users to
produce Landsat-based maps of land cover and land cover change and other derived
geophysical and biophysical products (Dwyer et al. 2018). Both ARD and WRS-2
surface reflectance products have a quality control layer that includes cloud mask
and data quality.
MODIS is a key instrument aboard the Terra and Aqua satellites. Terra was
launched on December 18, 1999, and across the equator from north to south in the
morning. Aqua was launched on May 4, 2002, and across the equator from south to
north in the afternoon. Terra and Aqua MODIS observe the globe every 1–2 days,
acquiring data in 36 spectral bands. Seven spectral bands and two TIRS bands were
designed for land applications (Table 2.2). MODIS observations have been well
calibrated. MODIS data products are validated (Justice et al. 2002). Due to their high
temporal and spectral resolutions, MODIS data products have been widely used in
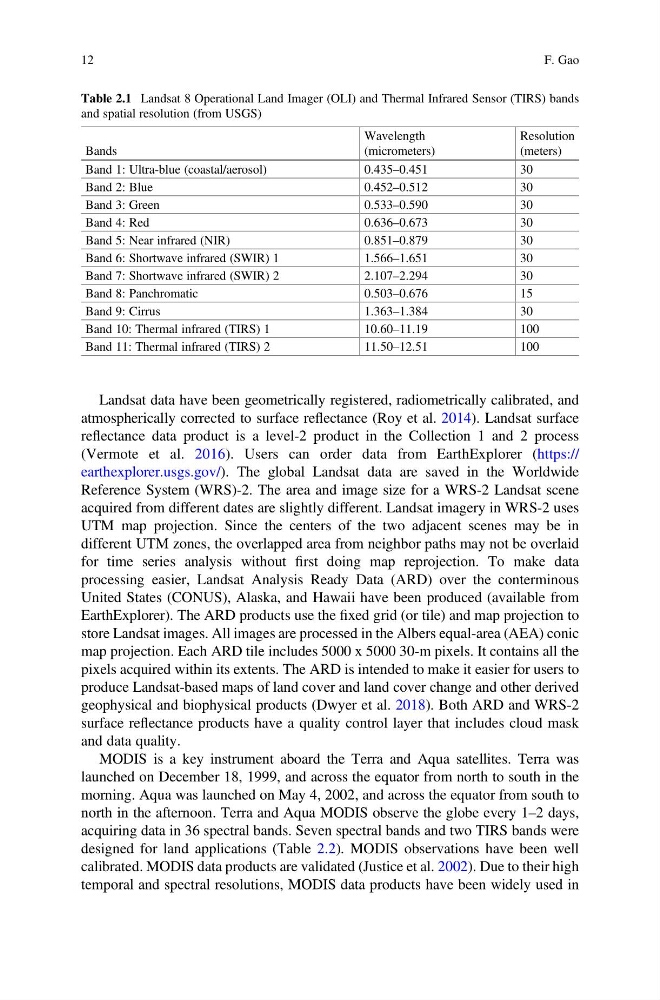
Table 2.1 Landsat 8 Operational Land Imager (OLI) and Thermal Infrared Sensor (TIRS) bands
and spatial resolution (from USGS)
Bands
Wavelength
(micrometers)
Resolution
(meters)
Band 1: Ultra-blue (coastal/aerosol)
0.435–0.451
30
Band 2: Blue
0.452–0.512
30
Band 3: Green
0.533–0.590
30
Band 4: Red
0.636–0.673
30
Band 5: Near infrared (NIR)
0.851–0.879
30
Band 6: Shortwave infrared (SWIR) 1
1.566–1.651
30
Band 7: Shortwave infrared (SWIR) 2
2.107–2.294
30
Band 8: Panchromatic
0.503–0.676
15
Band 9: Cirrus
1.363–1.384
30
Band 10: Thermal infrared (TIRS) 1
10.60–11.19
100
Band 11: Thermal infrared (TIRS) 2
11.50–12.51
100
12
F. Gao
atmospherically corrected to surface reflectance (Roy et al. 2014). Landsat surface
reflectance data product is a level-2 product in the Collection 1 and 2 process
(Vermote et al. 2016). Users can order data from EarthExplorer (https://
earthexplorer.usgs.gov/). The global Landsat data are saved in the Worldwide
Reference System (WRS)-2. The area and image size for a WRS-2 Landsat scene
acquired from different dates are slightly different. Landsat imagery in WRS-2 uses
UTM map projection. Since the centers of the two adjacent scenes may be in
different UTM zones, the overlapped area from neighbor paths may not be overlaid
for time series analysis without first doing map reprojection. To make data
processing easier, Landsat Analysis Ready Data (ARD) over the conterminous
United States (CONUS), Alaska, and Hawaii have been produced (available from
EarthExplorer). The ARD products use the fixed grid (or tile) and map projection to
store Landsat images. All images are processed in the Albers equal-area (AEA) conic
map projection. Each ARD tile includes 5000 x 5000 30-m pixels. It contains all the
pixels acquired within its extents. The ARD is intended to make it easier for users to
produce Landsat-based maps of land cover and land cover change and other derived
geophysical and biophysical products (Dwyer et al. 2018). Both ARD and WRS-2
surface reflectance products have a quality control layer that includes cloud mask
and data quality.
MODIS is a key instrument aboard the Terra and Aqua satellites. Terra was
launched on December 18, 1999, and across the equator from north to south in the
morning. Aqua was launched on May 4, 2002, and across the equator from south to
north in the afternoon. Terra and Aqua MODIS observe the globe every 1–2 days,
acquiring data in 36 spectral bands. Seven spectral bands and two TIRS bands were
designed for land applications (Table 2.2). MODIS observations have been well
calibrated. MODIS data products are validated (Justice et al. 2002). Due to their high
temporal and spectral resolutions, MODIS data products have been widely used in
Table 2.1 Landsat 8 Operational Land Imager (OLI) and Thermal Infrared Sensor (TIRS) bands
and spatial resolution (from USGS)
Bands
Wavelength
(micrometers)
Resolution
(meters)
Band 1: Ultra-blue (coastal/aerosol)
0.435–0.451
30
Band 2: Blue
0.452–0.512
30
Band 3: Green
0.533–0.590
30
Band 4: Red
0.636–0.673
30
Band 5: Near infrared (NIR)
0.851–0.879
30
Band 6: Shortwave infrared (SWIR) 1
1.566–1.651
30
Band 7: Shortwave infrared (SWIR) 2
2.107–2.294
30
Band 8: Panchromatic
0.503–0.676
15
Band 9: Cirrus
1.363–1.384
30
Band 10: Thermal infrared (TIRS) 1
10.60–11.19
100
Band 11: Thermal infrared (TIRS) 2
11.50–12.51
100
12
F. Gao