

10.2.3 Case Study – Operational National Cropland Mapping
Programs
10.2.3.1 USA Cropland Data Layer
Cropland Data Layer (CDL) is produced using the remote sensing approach (Johnson and Mueller 2010; Boryan et al. 2011). For preprocessing, they purchase or
obtain rectified remotely sensed observations, mainly Landsat TM and ETM+ and
ResourceSat-2 AWiFS. All available Landsat data or AWiFS data are collected
during the growing seasons. The time series of data allow the filling of clouded
areas and specific crop distinguish. The classifier is See5, a decision tree classifier.
Training samples are largely from the detailed, non-public June Survey of the USDA
Farm Service Agency. The classification is mainly scene-based that leaves the fine
radiometric correction unnecessary. Cloud quality bit from the rectified data producer is used in their classification to mask out the pixels during their training and
classification stages. National Land Cover Database (NLCD) is used in masking out
nonagricultural areas. Specific crop knowledge is used in distinguishing different
crops. The 2-week difference of planting between corn and soybean is one example
of knowledge that is applied in telling apart crops from time series of observations.
The CDL is produced annually since 2008 covering all the 48 states. Internally,
the CDL is produced in the middle season and made available for internal use. The
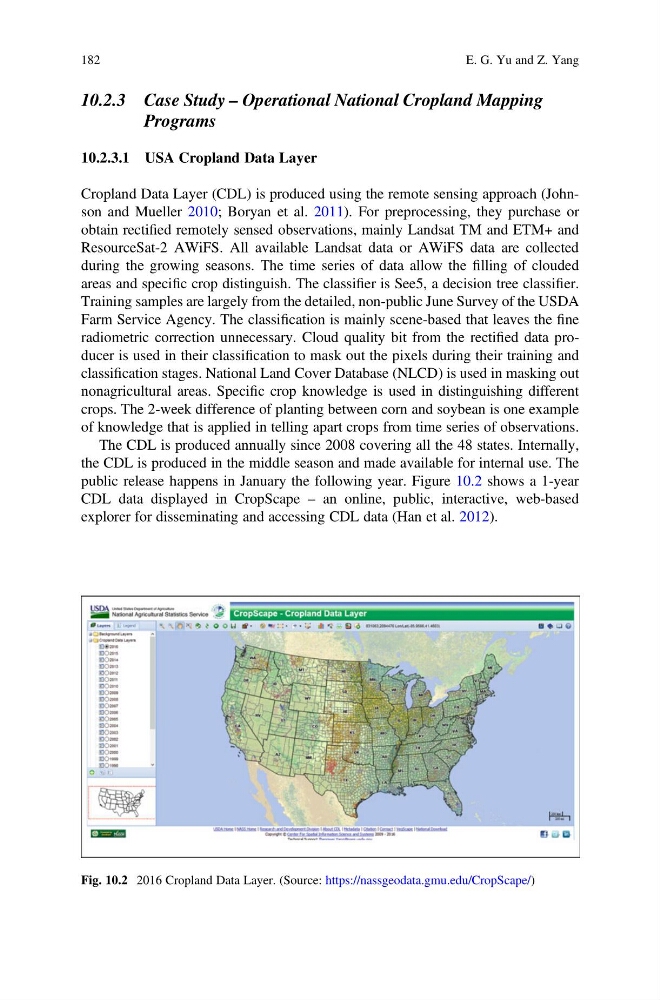
public release happens in January the following year. Figure 10.2 shows a 1-year
CDL data displayed in CropScape – an online, public, interactive, web-based
explorer for disseminating and accessing CDL data (Han et al. 2012).
Fig. 10.2 2016 Cropland Data Layer. (Source: https://nassgeodata.gmu.edu/CropScape/)
182
E. G. Yu and Z. Yang
Programs
10.2.3.1 USA Cropland Data Layer
Cropland Data Layer (CDL) is produced using the remote sensing approach (Johnson and Mueller 2010; Boryan et al. 2011). For preprocessing, they purchase or
obtain rectified remotely sensed observations, mainly Landsat TM and ETM+ and
ResourceSat-2 AWiFS. All available Landsat data or AWiFS data are collected
during the growing seasons. The time series of data allow the filling of clouded
areas and specific crop distinguish. The classifier is See5, a decision tree classifier.
Training samples are largely from the detailed, non-public June Survey of the USDA
Farm Service Agency. The classification is mainly scene-based that leaves the fine
radiometric correction unnecessary. Cloud quality bit from the rectified data producer is used in their classification to mask out the pixels during their training and
classification stages. National Land Cover Database (NLCD) is used in masking out
nonagricultural areas. Specific crop knowledge is used in distinguishing different
crops. The 2-week difference of planting between corn and soybean is one example
of knowledge that is applied in telling apart crops from time series of observations.
The CDL is produced annually since 2008 covering all the 48 states. Internally,
the CDL is produced in the middle season and made available for internal use. The
public release happens in January the following year. Figure 10.2 shows a 1-year
CDL data displayed in CropScape – an online, public, interactive, web-based
explorer for disseminating and accessing CDL data (Han et al. 2012).
Fig. 10.2 2016 Cropland Data Layer. (Source: https://nassgeodata.gmu.edu/CropScape/)
182
E. G. Yu and Z. Yang