

RF-CLASS is implemented with open interoperable standard web interfaces to
facilitate the interoperability with EO datasets in the NASA Earth Observing System
Data and Information System (EOSDIS). It calculates the flooded area using multiple sources of datasets, including MODIS, SMAP, Landsat, and NASA Dartmouth
Flood Observatory (DFO) daily surface water product. Meantime, RF-CLASS
derives the crop loss map using a regression model by analyzing the ratios of yield
change and the change of accumulated NDVI. It also has an implemented toolset to
support the simple spatiotemporal analysis of the time series datasets. As for the
capability demonstration and validation, the system assessed two flood events, one
in Missouri in 2011 and another one in Arkansas in 2006. Both use cases demonstrated and validated that RF-CLASS offers very helpful information and functionalities in assisting post-flood crop loss assessment.
8.4.6 SMAP Explorer
It is common knowledge that soil moisture is one of the most direct measures of
agricultural drought. However, the soil moisture products available in the past lacked
of either coverage or accuracy. To produce large-scale soil moisture products with
high quality, NASA has done a great deal of efforts on launching satellites and
developing algorithms. SMAP (Soil Moisture Active and Passive) mission is the
flagship of these efforts. The mission provides a reliable data source for cropland soil
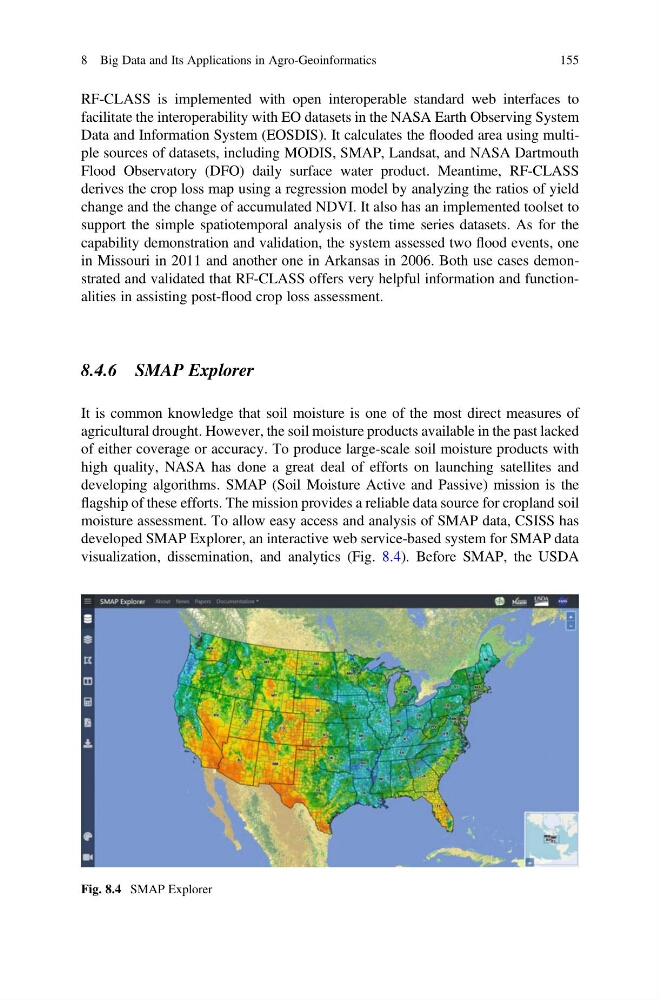
moisture assessment. To allow easy access and analysis of SMAP data, CSISS has
developed SMAP Explorer, an interactive web service-based system for SMAP data
visualization, dissemination, and analytics (Fig. 8.4). Before SMAP, the USDA
Fig. 8.4 SMAP Explorer
8 Big Data and Its Applications in Agro-Geoinformatics
155
facilitate the interoperability with EO datasets in the NASA Earth Observing System
Data and Information System (EOSDIS). It calculates the flooded area using multiple sources of datasets, including MODIS, SMAP, Landsat, and NASA Dartmouth
Flood Observatory (DFO) daily surface water product. Meantime, RF-CLASS
derives the crop loss map using a regression model by analyzing the ratios of yield
change and the change of accumulated NDVI. It also has an implemented toolset to
support the simple spatiotemporal analysis of the time series datasets. As for the
capability demonstration and validation, the system assessed two flood events, one
in Missouri in 2011 and another one in Arkansas in 2006. Both use cases demonstrated and validated that RF-CLASS offers very helpful information and functionalities in assisting post-flood crop loss assessment.
8.4.6 SMAP Explorer
It is common knowledge that soil moisture is one of the most direct measures of
agricultural drought. However, the soil moisture products available in the past lacked
of either coverage or accuracy. To produce large-scale soil moisture products with
high quality, NASA has done a great deal of efforts on launching satellites and
developing algorithms. SMAP (Soil Moisture Active and Passive) mission is the
flagship of these efforts. The mission provides a reliable data source for cropland soil
moisture assessment. To allow easy access and analysis of SMAP data, CSISS has
developed SMAP Explorer, an interactive web service-based system for SMAP data
visualization, dissemination, and analytics (Fig. 8.4). Before SMAP, the USDA
Fig. 8.4 SMAP Explorer
8 Big Data and Its Applications in Agro-Geoinformatics
155