

farmers, government agencies, and crop insurance companies (Sun et al. 2019c).
Figure 8.1 shows that in the first 2 weeks of October 2019, there was exceptional
drought in Southern Africa, Australia, Eastern Europe, Eastern Brazil, and the
Midwest United States. Users can zoom the map into their interested region, e.g.,
their own farms, to check the current drought condition (Sun et al. 2017a).
8.4.3 CropScape
CropScape, a collaborative effort of CSISS and USDA (US Department of Agriculture) NASS (National Agricultural Statistics Service), is a web service-based US
crop information system (Yang et al. 2013; Han et al. 2012). CropScape hosts the
Cropland Data Layer (CDL), which is a raster, geo-referenced, crop-specific land
cover data layer created annually for the contiguous United States (CONUS) since
2008 (some states have data back to 1997) (Boryan et al. 2011). CDL is produced by
moderate-resolution satellite imagery primarily from Landsat and extensive agricultural ground truth collected by the USDA NASS. CropScape provides a bundle of
useful tools for users to flexibly browse, visualize, download, analyze, and export
CDL (Han et al. 2012). It has been validated by consumer feedbacks as an excellent
tool. CropScape greatly enhances the spreading and use of CDL in the agricultural
and socioeconomic communities. CDL is specialized in mapping more than 100 categories of land use classes in agriculture and has been widely used in many
researches and real-world decision-making scenarios. Today the system has tens of
thousands of active users from all over the world and serves as a fundamental
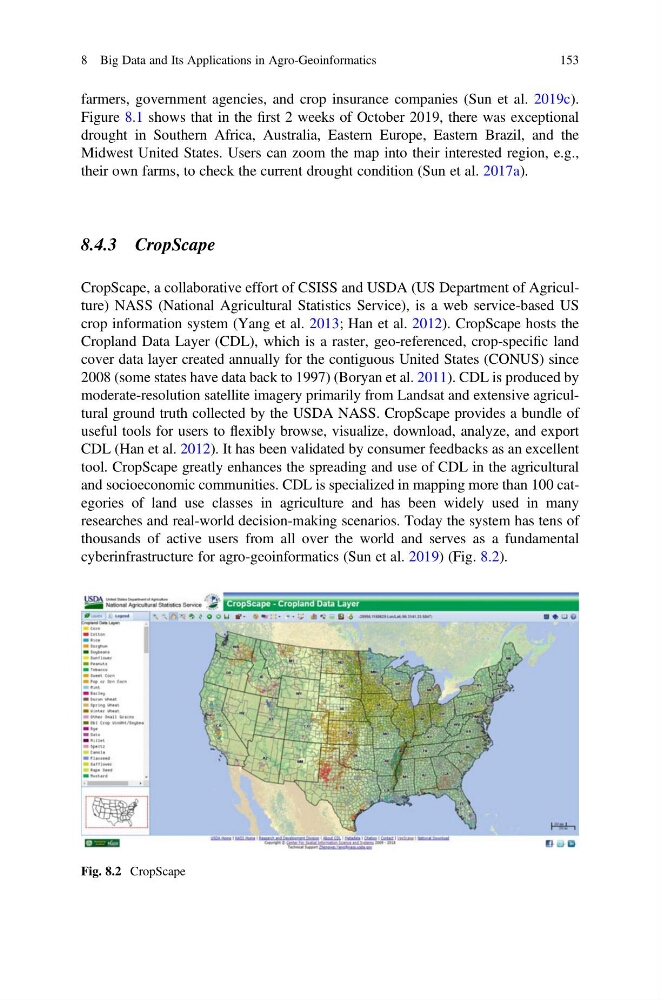
cyberinfrastructure for agro-geoinformatics (Sun et al. 2019) (Fig. 8.2).
Fig. 8.2 CropScape
8 Big Data and Its Applications in Agro-Geoinformatics
153
Figure 8.1 shows that in the first 2 weeks of October 2019, there was exceptional
drought in Southern Africa, Australia, Eastern Europe, Eastern Brazil, and the
Midwest United States. Users can zoom the map into their interested region, e.g.,
their own farms, to check the current drought condition (Sun et al. 2017a).
8.4.3 CropScape
CropScape, a collaborative effort of CSISS and USDA (US Department of Agriculture) NASS (National Agricultural Statistics Service), is a web service-based US
crop information system (Yang et al. 2013; Han et al. 2012). CropScape hosts the
Cropland Data Layer (CDL), which is a raster, geo-referenced, crop-specific land
cover data layer created annually for the contiguous United States (CONUS) since
2008 (some states have data back to 1997) (Boryan et al. 2011). CDL is produced by
moderate-resolution satellite imagery primarily from Landsat and extensive agricultural ground truth collected by the USDA NASS. CropScape provides a bundle of
useful tools for users to flexibly browse, visualize, download, analyze, and export
CDL (Han et al. 2012). It has been validated by consumer feedbacks as an excellent
tool. CropScape greatly enhances the spreading and use of CDL in the agricultural
and socioeconomic communities. CDL is specialized in mapping more than 100 categories of land use classes in agriculture and has been widely used in many
researches and real-world decision-making scenarios. Today the system has tens of
thousands of active users from all over the world and serves as a fundamental
cyberinfrastructure for agro-geoinformatics (Sun et al. 2019) (Fig. 8.2).
Fig. 8.2 CropScape
8 Big Data and Its Applications in Agro-Geoinformatics
153