

observations. Otherwise, if a specific parcel is considered, then the exact sowing
time must be used as the reference date for the initiation of the real-time computations. Phenological stage–based segmentation also enables the prediction of the
phenological stage dates and the harvesting date by using another set of regression
model that represents the state transition functions (Üstündağ 2017).
Remote sensing data is used both for the crop/land cover estimation and calculation of some indices also in correlation with yield efficiency. Both seasonal VHR
satellite images and multitemporal/multispectral images are used at different frequencies for this purpose. Agrometeorological data is first converted into indices in
correlation with phenological stage durations. We have considered seven stages for
cereals as listed below:
1. Emergence
2. Floral initiation (double ridge)
3. Terminal spikelet
4. First node
5. Heading
6. Anthesis
7. Physiological maturity
In the third step, some other agrometeorological and remote sensing index sets are
segmented with respect to the phenological stage transition date intervals. This data
segmentation converts the chronological data into biological timing of the crops.
Sample dataset in the Appendix includes widely used agrometeorological indices for
the explanations and example regression model-based data fusion here. Dataset
consists of separate tables for each phenological stage (as stage 1, . . ., stage 7) and
the total values.
Crop yield computations rely on matching the actual crop area mapping and crop
yield efficiency mappings for dry farming and irrigated conditions separately.
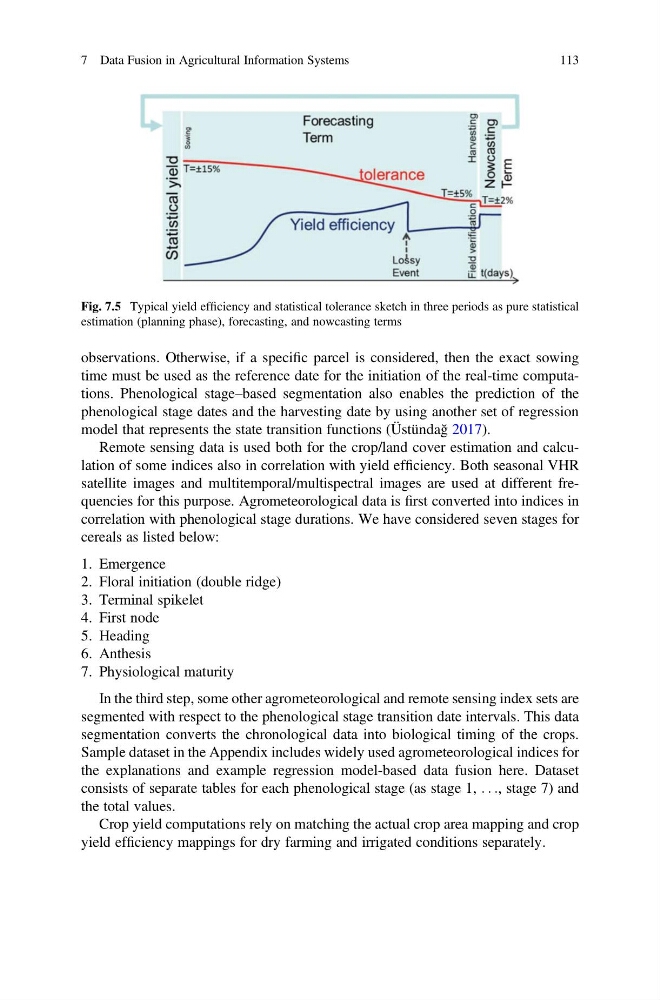
Fig. 7.5 Typical yield efficiency and statistical tolerance sketch in three periods as pure statistical
estimation (planning phase), forecasting, and nowcasting terms
7 Data Fusion in Agricultural Information Systems
113
time must be used as the reference date for the initiation of the real-time computations. Phenological stage–based segmentation also enables the prediction of the
phenological stage dates and the harvesting date by using another set of regression
model that represents the state transition functions (Üstündağ 2017).
Remote sensing data is used both for the crop/land cover estimation and calculation of some indices also in correlation with yield efficiency. Both seasonal VHR
satellite images and multitemporal/multispectral images are used at different frequencies for this purpose. Agrometeorological data is first converted into indices in
correlation with phenological stage durations. We have considered seven stages for
cereals as listed below:
1. Emergence
2. Floral initiation (double ridge)
3. Terminal spikelet
4. First node
5. Heading
6. Anthesis
7. Physiological maturity
In the third step, some other agrometeorological and remote sensing index sets are
segmented with respect to the phenological stage transition date intervals. This data
segmentation converts the chronological data into biological timing of the crops.
Sample dataset in the Appendix includes widely used agrometeorological indices for
the explanations and example regression model-based data fusion here. Dataset
consists of separate tables for each phenological stage (as stage 1, . . ., stage 7) and
the total values.
Crop yield computations rely on matching the actual crop area mapping and crop
yield efficiency mappings for dry farming and irrigated conditions separately.
Fig. 7.5 Typical yield efficiency and statistical tolerance sketch in three periods as pure statistical
estimation (planning phase), forecasting, and nowcasting terms
7 Data Fusion in Agricultural Information Systems
113