

very inverse relay,
TMS =
Isc
Iset
− 1
13.5
× t OCR ,
(13)
t OCR =
13.5
Isc
Iset
− 1
× TMS;
extremely inverse relay,
TMS =
Isc
Iset
2 − 1
80
× t OCR ,
(14)
t OCR =
80
Isc
Iset
2 − 1
× TMS;
t OCR is tripping time of overcurrent relay Figure 10
demonstrates the power system model to be set and
coordinated using overcurrent relays
3 RESULTS AND DISCUSSIONS
3.1 Frequency response characteristics
In this research paper, during the load disturbance
conditions, frequency load PID controllers have been
developed and performed in balancing steady state
condition by considering the values of overshoot,
steady state error, and settling time. The frequency has
been stabilized and balanced by using PID controllers
in single area and two area hydroelectric power plants.
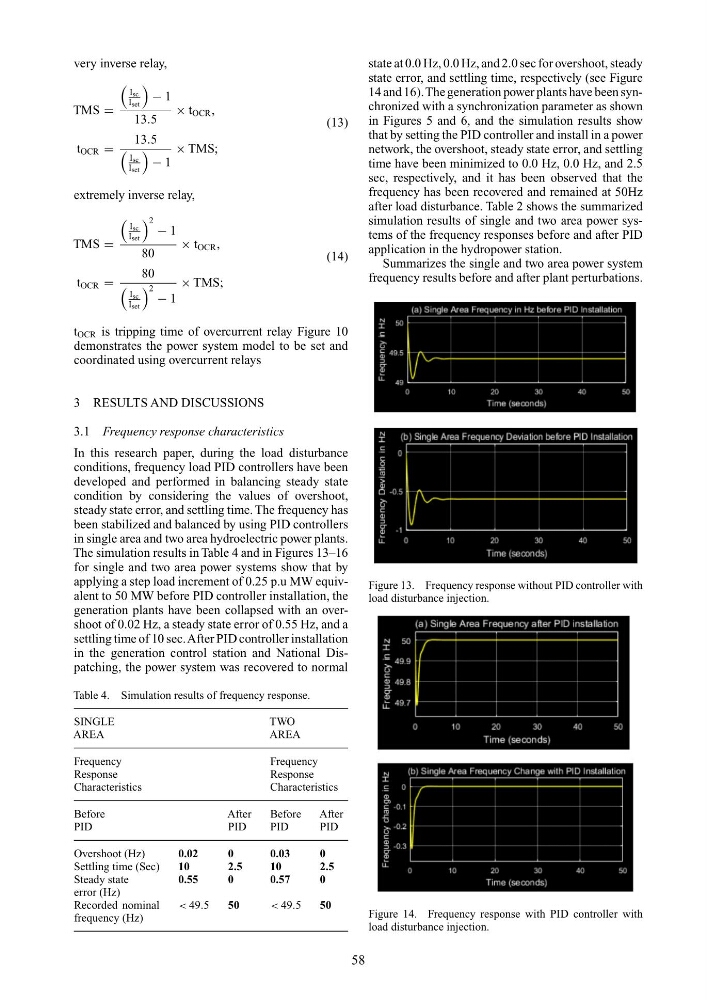
The simulation results in Table 4 and in Figures 13–16
for single and two area power systems show that by
applying a step load increment of 0.25 p.u MW equivalent to 50 MW before PID controller installation, the
generation plants have been collapsed with an overshoot of 0.02 Hz, a steady state error of 0.55 Hz, and a
settling time of 10 sec. After PID controller installation
in the generation control station and National Dispatching, the power system was recovered to normal
Table 4. Simulation results of frequency response.
SINGLE
TWO
AREA
AREA
Frequency
Frequency
Response
Response
Characteristics
Characteristics
Before
After
Before
After
PID
PID
PID
PID
Overshoot (Hz)
0.02
0
0.03
0
Settling time (Sec)
10
2.5
10
2.5
Steady state
error (Hz)
0.55
0
0.57
0
Recorded nominal
frequency (Hz)
< 49.5
50
< 49.5
50
state at 0.0 Hz, 0.0 Hz, and 2.0 sec for overshoot, steady
state error, and settling time, respectively (see Figure
14 and 16).The generation power plants have been synchronized with a synchronization parameter as shown
in Figures 5 and 6, and the simulation results show
that by setting the PID controller and install in a power
network, the overshoot, steady state error, and settling
time have been minimized to 0.0 Hz, 0.0 Hz, and 2.5
sec, respectively, and it has been observed that the
frequency has been recovered and remained at 50Hz
after load disturbance. Table 2 shows the summarized
simulation results of single and two area power systems of the frequency responses before and after PID
application in the hydropower station.
Summarizes the single and two area power system
frequency results before and after plant perturbations.
Figure 13. Frequency response without PID controller with
load disturbance injection.
Figure 14. Frequency response with PID controller with
load disturbance injection.
58
TMS =
Isc
Iset
− 1
13.5
× t OCR ,
(13)
t OCR =
13.5
Isc
Iset
− 1
× TMS;
extremely inverse relay,
TMS =
Isc
Iset
2 − 1
80
× t OCR ,
(14)
t OCR =
80
Isc
Iset
2 − 1
× TMS;
t OCR is tripping time of overcurrent relay Figure 10
demonstrates the power system model to be set and
coordinated using overcurrent relays
3 RESULTS AND DISCUSSIONS
3.1 Frequency response characteristics
In this research paper, during the load disturbance
conditions, frequency load PID controllers have been
developed and performed in balancing steady state
condition by considering the values of overshoot,
steady state error, and settling time. The frequency has
been stabilized and balanced by using PID controllers
in single area and two area hydroelectric power plants.
The simulation results in Table 4 and in Figures 13–16
for single and two area power systems show that by
applying a step load increment of 0.25 p.u MW equivalent to 50 MW before PID controller installation, the
generation plants have been collapsed with an overshoot of 0.02 Hz, a steady state error of 0.55 Hz, and a
settling time of 10 sec. After PID controller installation
in the generation control station and National Dispatching, the power system was recovered to normal
Table 4. Simulation results of frequency response.
SINGLE
TWO
AREA
AREA
Frequency
Frequency
Response
Response
Characteristics
Characteristics
Before
After
Before
After
PID
PID
PID
PID
Overshoot (Hz)
0.02
0
0.03
0
Settling time (Sec)
10
2.5
10
2.5
Steady state
error (Hz)
0.55
0
0.57
0
Recorded nominal
frequency (Hz)
< 49.5
50
< 49.5
50
state at 0.0 Hz, 0.0 Hz, and 2.0 sec for overshoot, steady
state error, and settling time, respectively (see Figure
14 and 16).The generation power plants have been synchronized with a synchronization parameter as shown
in Figures 5 and 6, and the simulation results show
that by setting the PID controller and install in a power
network, the overshoot, steady state error, and settling
time have been minimized to 0.0 Hz, 0.0 Hz, and 2.5
sec, respectively, and it has been observed that the
frequency has been recovered and remained at 50Hz
after load disturbance. Table 2 shows the summarized
simulation results of single and two area power systems of the frequency responses before and after PID
application in the hydropower station.
Summarizes the single and two area power system
frequency results before and after plant perturbations.
Figure 13. Frequency response without PID controller with
load disturbance injection.
Figure 14. Frequency response with PID controller with
load disturbance injection.
58