

Figure 15. Frequency response of two area power generation without PID controllers.
Figure 16. Synchronized frequency response with PID
controllers in two areas after disturbances.
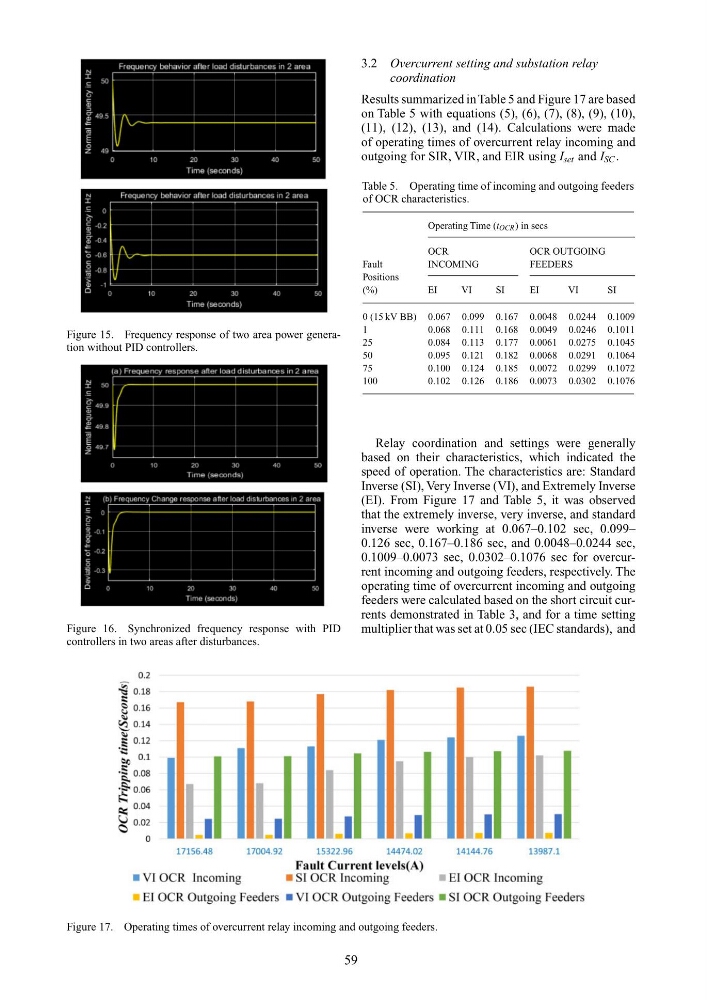
Figure 17. Operating times of overcurrent relay incoming and outgoing feeders.
3.2 Overcurrent setting and substation relay
coordination
Results summarized in Table 5 and Figure 17 are based
on Table 5 with equations (5), (6), (7), (8), (9), (10),
(11), (12), (13), and (14). Calculations were made
of operating times of overcurrent relay incoming and
outgoing for SIR, VIR, and EIR using I set and I SC .
Table 5. Operating time of incoming and outgoing feeders
of OCR characteristics.
Operating Time (t OCR ) in secs
OCR
OCR OUTGOING
Fault
INCOMING
FEEDERS
Positions
(%)
EI
VI
SI
EI
VI
SI
0 (15 kV BB) 0.067 0.099 0.167 0.0048 0.0244 0.1009
1
0.068 0.111 0.168 0.0049 0.0246 0.1011
25
0.084 0.113 0.177 0.0061 0.0275 0.1045
50
0.095 0.121 0.182 0.0068 0.0291 0.1064
75
0.100 0.124 0.185 0.0072 0.0299 0.1072
100
0.102 0.126 0.186 0.0073 0.0302 0.1076
Relay coordination and settings were generally
based on their characteristics, which indicated the
speed of operation. The characteristics are: Standard
Inverse (SI), Very Inverse (VI), and Extremely Inverse
(EI). From Figure 17 and Table 5, it was observed
that the extremely inverse, very inverse, and standard
inverse were working at 0.067–0.102 sec, 0.099–
0.126 sec, 0.167–0.186 sec, and 0.0048–0.0244 sec,
0.1009–0.0073 sec, 0.0302–0.1076 sec for overcurrent incoming and outgoing feeders, respectively. The
operating time of overcurrent incoming and outgoing
feeders were calculated based on the short circuit currents demonstrated in Table 3, and for a time setting
multiplier that was set at 0.05 sec (IEC standards), and
59
Figure 16. Synchronized frequency response with PID
controllers in two areas after disturbances.
Figure 17. Operating times of overcurrent relay incoming and outgoing feeders.
3.2 Overcurrent setting and substation relay
coordination
Results summarized in Table 5 and Figure 17 are based
on Table 5 with equations (5), (6), (7), (8), (9), (10),
(11), (12), (13), and (14). Calculations were made
of operating times of overcurrent relay incoming and
outgoing for SIR, VIR, and EIR using I set and I SC .
Table 5. Operating time of incoming and outgoing feeders
of OCR characteristics.
Operating Time (t OCR ) in secs
OCR
OCR OUTGOING
Fault
INCOMING
FEEDERS
Positions
(%)
EI
VI
SI
EI
VI
SI
0 (15 kV BB) 0.067 0.099 0.167 0.0048 0.0244 0.1009
1
0.068 0.111 0.168 0.0049 0.0246 0.1011
25
0.084 0.113 0.177 0.0061 0.0275 0.1045
50
0.095 0.121 0.182 0.0068 0.0291 0.1064
75
0.100 0.124 0.185 0.0072 0.0299 0.1072
100
0.102 0.126 0.186 0.0073 0.0302 0.1076
Relay coordination and settings were generally
based on their characteristics, which indicated the
speed of operation. The characteristics are: Standard
Inverse (SI), Very Inverse (VI), and Extremely Inverse
(EI). From Figure 17 and Table 5, it was observed
that the extremely inverse, very inverse, and standard
inverse were working at 0.067–0.102 sec, 0.099–
0.126 sec, 0.167–0.186 sec, and 0.0048–0.0244 sec,
0.1009–0.0073 sec, 0.0302–0.1076 sec for overcurrent incoming and outgoing feeders, respectively. The
operating time of overcurrent incoming and outgoing
feeders were calculated based on the short circuit currents demonstrated in Table 3, and for a time setting
multiplier that was set at 0.05 sec (IEC standards), and
59