

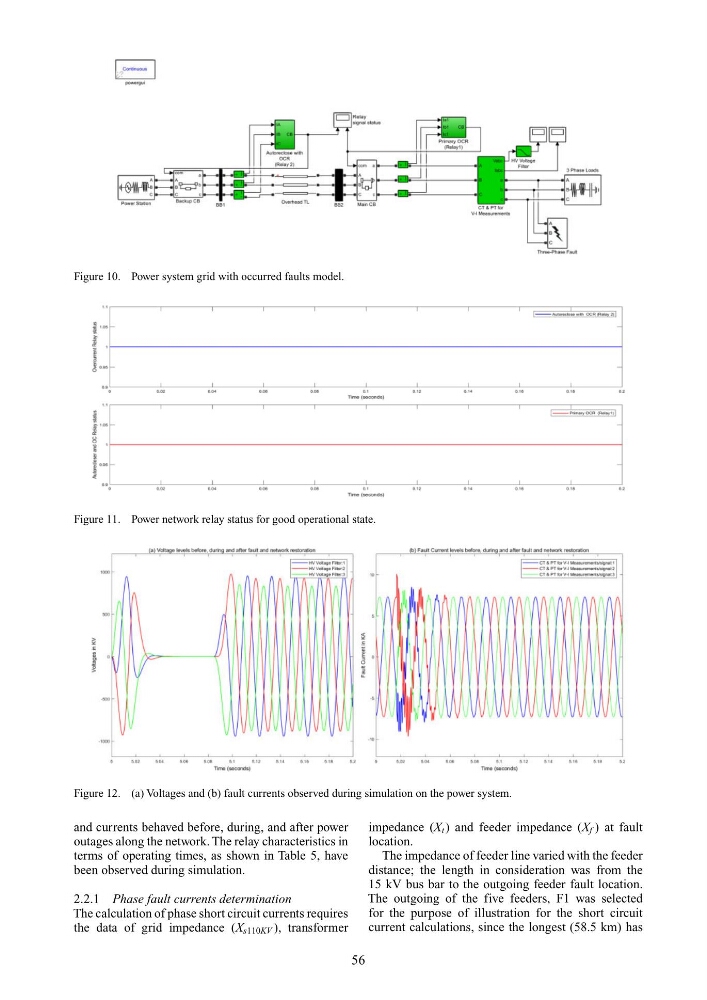
Figure 10. Power system grid with occurred faults model.
Figure 11. Power network relay status for good operational state.
Figure 12. (a) Voltages and (b) fault currents observed during simulation on the power system.
and currents behaved before, during, and after power
outages along the network. The relay characteristics in
terms of operating times, as shown in Table 5, have
been observed during simulation.
2.2.1 Phase fault currents determination
The calculation of phase short circuit currents requires
the data of grid impedance (X s110KV ), transformer
impedance (X t ) and feeder impedance (X f ) at fault
location.
The impedance of feeder line varied with the feeder
distance; the length in consideration was from the
15 kV bus bar to the outgoing feeder fault location.
The outgoing of the five feeders, F1 was selected
for the purpose of illustration for the short circuit
current calculations, since the longest (58.5 km) has
56
Figure 11. Power network relay status for good operational state.
Figure 12. (a) Voltages and (b) fault currents observed during simulation on the power system.
and currents behaved before, during, and after power
outages along the network. The relay characteristics in
terms of operating times, as shown in Table 5, have
been observed during simulation.
2.2.1 Phase fault currents determination
The calculation of phase short circuit currents requires
the data of grid impedance (X s110KV ), transformer
impedance (X t ) and feeder impedance (X f ) at fault
location.
The impedance of feeder line varied with the feeder
distance; the length in consideration was from the
15 kV bus bar to the outgoing feeder fault location.
The outgoing of the five feeders, F1 was selected
for the purpose of illustration for the short circuit
current calculations, since the longest (58.5 km) has
56