

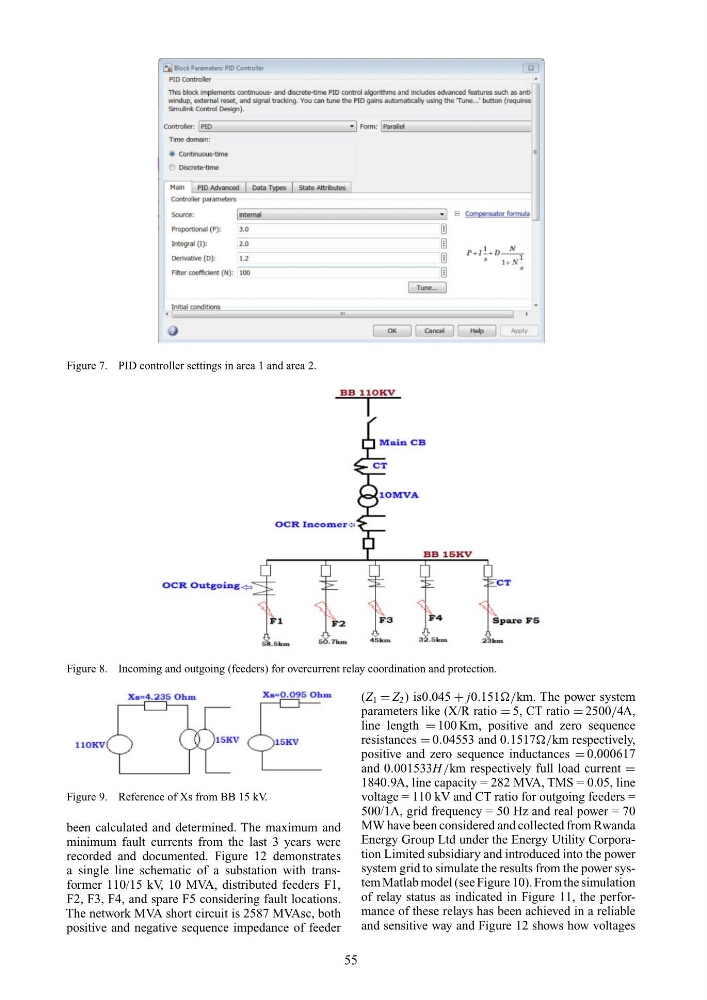
Figure 7. PID controller settings in area 1 and area 2.
Figure 8. Incoming and outgoing (feeders) for overcurrent relay coordination and protection.
Figure 9. Reference of Xs from BB 15 kV.
been calculated and determined. The maximum and
minimum fault currents from the last 3 years were
recorded and documented. Figure 12 demonstrates
a single line schematic of a substation with transformer 110/15 kV, 10 MVA, distributed feeders F1,
F2, F3, F4, and spare F5 considering fault locations.
The network MVA short circuit is 2587 MVAsc, both
positive and negative sequence impedance of feeder
(Z 1 = Z 2 ) is0.045 + j0.151/km. The power system
parameters like (X/R ratio = 5, CT ratio = 2500/4A,
line length = 100 Km, positive and zero sequence
resistances = 0.04553 and 0.1517/km respectively,
positive and zero sequence inductances = 0.000617
and 0.001533H /km respectively full load current =
1840.9A, line capacity = 282 MVA, TMS = 0.05, line
voltage = 110 kV and CT ratio for outgoing feeders =
500/1A, grid frequency = 50 Hz and real power = 70
MW have been considered and collected from Rwanda
Energy Group Ltd under the Energy Utility Corporation Limited subsidiary and introduced into the power
system grid to simulate the results from the power system Matlab model (see Figure 10). From the simulation
of relay status as indicated in Figure 11, the performance of these relays has been achieved in a reliable
and sensitive way and Figure 12 shows how voltages
55
Figure 8. Incoming and outgoing (feeders) for overcurrent relay coordination and protection.
Figure 9. Reference of Xs from BB 15 kV.
been calculated and determined. The maximum and
minimum fault currents from the last 3 years were
recorded and documented. Figure 12 demonstrates
a single line schematic of a substation with transformer 110/15 kV, 10 MVA, distributed feeders F1,
F2, F3, F4, and spare F5 considering fault locations.
The network MVA short circuit is 2587 MVAsc, both
positive and negative sequence impedance of feeder
(Z 1 = Z 2 ) is0.045 + j0.151/km. The power system
parameters like (X/R ratio = 5, CT ratio = 2500/4A,
line length = 100 Km, positive and zero sequence
resistances = 0.04553 and 0.1517/km respectively,
positive and zero sequence inductances = 0.000617
and 0.001533H /km respectively full load current =
1840.9A, line capacity = 282 MVA, TMS = 0.05, line
voltage = 110 kV and CT ratio for outgoing feeders =
500/1A, grid frequency = 50 Hz and real power = 70
MW have been considered and collected from Rwanda
Energy Group Ltd under the Energy Utility Corporation Limited subsidiary and introduced into the power
system grid to simulate the results from the power system Matlab model (see Figure 10). From the simulation
of relay status as indicated in Figure 11, the performance of these relays has been achieved in a reliable
and sensitive way and Figure 12 shows how voltages
55