

3.6 Determination of COD
COD was determined based on closed reflux, Colorimetric standard method-5220D. The standard and
substrate samples were treated in standard potassium dichromate solution (K 2 Cr 2 O) and sulfuric acid
reagent. The reduction of dichromate absorbance was
measured using a UVs spectrometer. The standard
samples were prepared using potassium hydrogen
phthalate with COD equivalence.
3.7 Determination of total solids (TS), total
suspended solids (TSS), and total dissolved
solids (TDS)
TS, TSS, and TDS for the substrates was determined
based on standard methods (2,540B, 2,540C, and
2,540D) for the examination of water and wastewater by Eaton et al. (1995). Vinasse was well mixed and
evaporated in a weighed dish and dried to constant
weight in an oven at 103 − 105
◦ C, while maize stalks
were dried directly. The decrease in weight over that of
the empty dish represents the solids. The relationship
between TS, TSS, and TDS is given by the following
expression;
TS = TSS + TDS
(3)
3.8 Biogas production
3.8.1 Experiment setup
Biogas production from sugar cane vinasse (SV) and
maize stalks (MS) was analysed in a batch anaerobic
test at 37.5
◦ C according to Linke and Schelle (2000). A
constant mesophilic temperature of 37.5
◦ C was maintained through a water bath. Fresh cow-dung from Moi
university farm was used as inocula in this study. 20mL
of inocula was mixed with 40mL of vinasse and 40mL
of pretreated maize stalks in separate digestion vessels (250mL conical flasks) and labelled runs 1 and
2, respectively. In each run, three conical flasks we
rearranged in a way that the first flask contained substrate; the middle contained water and the last was for
collecting water that was expelled out of the second
container (Budiyono et al 2010a, 2010b). The cocks
of all digesters were sealed tightly using clear silicon
glue in order to control the entry of air and loss of
biogas as indicated in Figure 1. Shaking of digesters
was done manually on a daily basis to ensure contact
between the substrate molecules and microbial cells.
Figure 1. Experiment setup.
4 RESULTS AND DISCUSSION
4.1 Substrates
The characteristics of the substrates were analysed
before digestion. The pH, moisture %, COD g/L, total
solids %, total suspended solids %, total dissolved
solids %, carbon content (TOC), nitrogen content, and
C/N ration were determined based on standard procedures outlined in the study. The results were recorded
in the table below.
Table 2. Composition of various components of maize stalks
and vinasse.
Parameters
Maize stalks
Vinasse
pH
7.52
4.34
Moisture %
9.52
93.91
COD g/L
**
71.28
Total solids (%)
91.50
7.05
Total suspended solids %
90.12
6.04
Total dissolved solids %
7.38
1.01
Carbon content (TOC)
49.51g/kg
2.23g/l
Nitrogen content
1.28g/kg
0.27g/l
C/N ratio
38.68
8.25
Key: Number of repetition (n) =3, except for pH and TOC
which has n = 1. **Not applicable.
The characteristics of the substrates are suitable for
biogas production as supported by the result posted by
Kirchgebner(1997) and Mahnert et al. (2002).
4.2 Biogas production
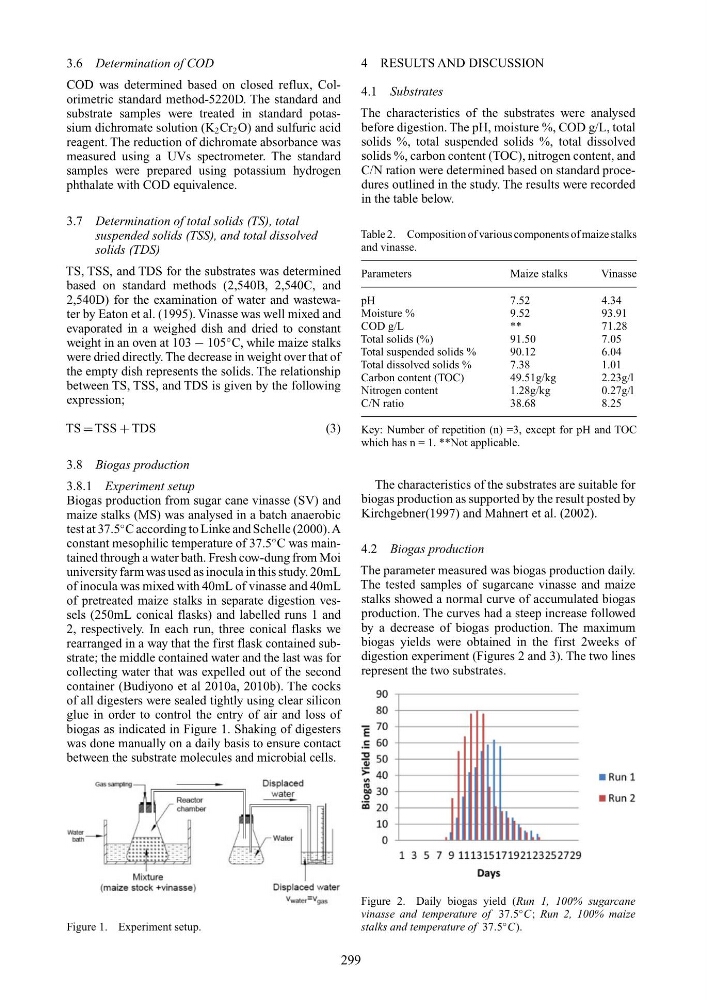
The parameter measured was biogas production daily.
The tested samples of sugarcane vinasse and maize
stalks showed a normal curve of accumulated biogas
production. The curves had a steep increase followed
by a decrease of biogas production. The maximum
biogas yields were obtained in the first 2weeks of
digestion experiment (Figures 2 and 3). The two lines
represent the two substrates.
Figure 2. Daily biogas yield (Run 1, 100% sugarcane
vinasse and temperature of 37.5
◦ C; Run 2, 100% maize
stalks and temperature of 37.5
◦ C).
299
COD was determined based on closed reflux, Colorimetric standard method-5220D. The standard and
substrate samples were treated in standard potassium dichromate solution (K 2 Cr 2 O) and sulfuric acid
reagent. The reduction of dichromate absorbance was
measured using a UVs spectrometer. The standard
samples were prepared using potassium hydrogen
phthalate with COD equivalence.
3.7 Determination of total solids (TS), total
suspended solids (TSS), and total dissolved
solids (TDS)
TS, TSS, and TDS for the substrates was determined
based on standard methods (2,540B, 2,540C, and
2,540D) for the examination of water and wastewater by Eaton et al. (1995). Vinasse was well mixed and
evaporated in a weighed dish and dried to constant
weight in an oven at 103 − 105
◦ C, while maize stalks
were dried directly. The decrease in weight over that of
the empty dish represents the solids. The relationship
between TS, TSS, and TDS is given by the following
expression;
TS = TSS + TDS
(3)
3.8 Biogas production
3.8.1 Experiment setup
Biogas production from sugar cane vinasse (SV) and
maize stalks (MS) was analysed in a batch anaerobic
test at 37.5
◦ C according to Linke and Schelle (2000). A
constant mesophilic temperature of 37.5
◦ C was maintained through a water bath. Fresh cow-dung from Moi
university farm was used as inocula in this study. 20mL
of inocula was mixed with 40mL of vinasse and 40mL
of pretreated maize stalks in separate digestion vessels (250mL conical flasks) and labelled runs 1 and
2, respectively. In each run, three conical flasks we
rearranged in a way that the first flask contained substrate; the middle contained water and the last was for
collecting water that was expelled out of the second
container (Budiyono et al 2010a, 2010b). The cocks
of all digesters were sealed tightly using clear silicon
glue in order to control the entry of air and loss of
biogas as indicated in Figure 1. Shaking of digesters
was done manually on a daily basis to ensure contact
between the substrate molecules and microbial cells.
Figure 1. Experiment setup.
4 RESULTS AND DISCUSSION
4.1 Substrates
The characteristics of the substrates were analysed
before digestion. The pH, moisture %, COD g/L, total
solids %, total suspended solids %, total dissolved
solids %, carbon content (TOC), nitrogen content, and
C/N ration were determined based on standard procedures outlined in the study. The results were recorded
in the table below.
Table 2. Composition of various components of maize stalks
and vinasse.
Parameters
Maize stalks
Vinasse
pH
7.52
4.34
Moisture %
9.52
93.91
COD g/L
**
71.28
Total solids (%)
91.50
7.05
Total suspended solids %
90.12
6.04
Total dissolved solids %
7.38
1.01
Carbon content (TOC)
49.51g/kg
2.23g/l
Nitrogen content
1.28g/kg
0.27g/l
C/N ratio
38.68
8.25
Key: Number of repetition (n) =3, except for pH and TOC
which has n = 1. **Not applicable.
The characteristics of the substrates are suitable for
biogas production as supported by the result posted by
Kirchgebner(1997) and Mahnert et al. (2002).
4.2 Biogas production
The parameter measured was biogas production daily.
The tested samples of sugarcane vinasse and maize
stalks showed a normal curve of accumulated biogas
production. The curves had a steep increase followed
by a decrease of biogas production. The maximum
biogas yields were obtained in the first 2weeks of
digestion experiment (Figures 2 and 3). The two lines
represent the two substrates.
Figure 2. Daily biogas yield (Run 1, 100% sugarcane
vinasse and temperature of 37.5
◦ C; Run 2, 100% maize
stalks and temperature of 37.5
◦ C).
299