

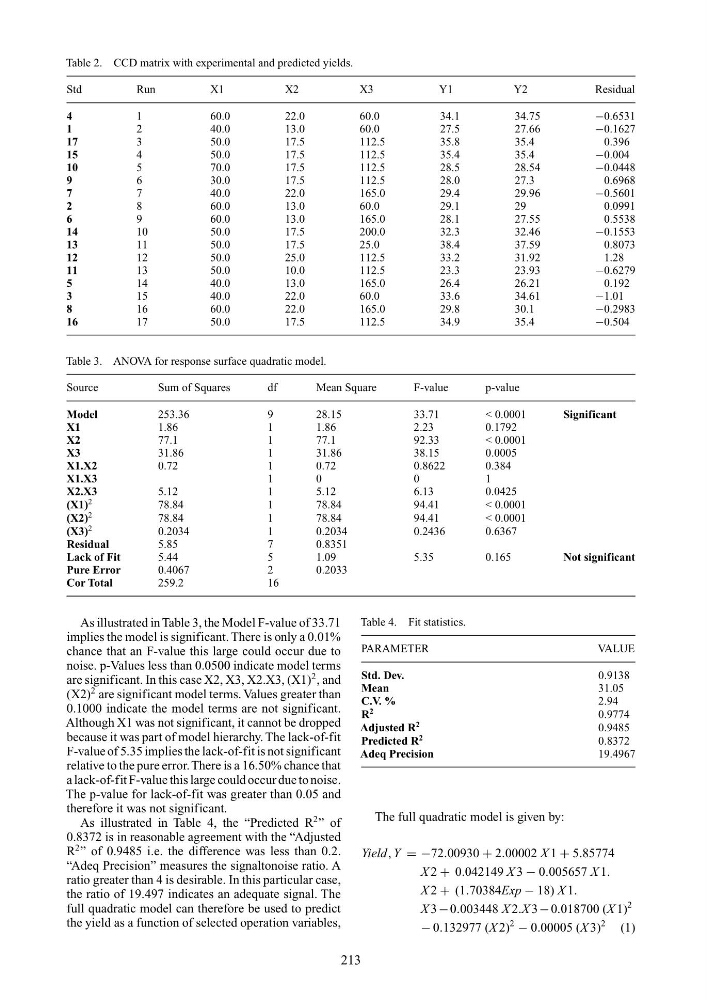
Table 2. CCD matrix with experimental and predicted yields.
Std
Run
X1
X2
X3
Y1
Y2
Residual
4
1
60.0
22.0
60.0
34.1
34.75
−0.6531
1
2
40.0
13.0
60.0
27.5
27.66
−0.1627
17
3
50.0
17.5
112.5
35.8
35.4
0.396
15
4
50.0
17.5
112.5
35.4
35.4
−0.004
10
5
70.0
17.5
112.5
28.5
28.54
−0.0448
9
6
30.0
17.5
112.5
28.0
27.3
0.6968
7
7
40.0
22.0
165.0
29.4
29.96
−0.5601
2
8
60.0
13.0
60.0
29.1
29
0.0991
6
9
60.0
13.0
165.0
28.1
27.55
0.5538
14
10
50.0
17.5
200.0
32.3
32.46
−0.1553
13
11
50.0
17.5
25.0
38.4
37.59
0.8073
12
12
50.0
25.0
112.5
33.2
31.92
1.28
11
13
50.0
10.0
112.5
23.3
23.93
−0.6279
5
14
40.0
13.0
165.0
26.4
26.21
0.192
3
15
40.0
22.0
60.0
33.6
34.61
−1.01
8
16
60.0
22.0
165.0
29.8
30.1
−0.2983
16
17
50.0
17.5
112.5
34.9
35.4
−0.504
Table 3. ANOVA for response surface quadratic model.
Source
Sum of Squares
df
Mean Square
F-value
p-value
Model
253.36
9
28.15
33.71
< 0.0001
Significant
X1
1.86
1
1.86
2.23
0.1792
X2
77.1
1
77.1
92.33
< 0.0001
X3
31.86
1
31.86
38.15
0.0005
X1.X2
0.72
1
0.72
0.8622
0.384
X1.X3
1
0
0
1
X2.X3
5.12
1
5.12
6.13
0.0425
(X1)
2
78.84
1
78.84
94.41
< 0.0001
(X2)
2
78.84
1
78.84
94.41
< 0.0001
(X3)
2
0.2034
1
0.2034
0.2436
0.6367
Residual
5.85
7
0.8351
Lack of Fit
5.44
5
1.09
5.35
0.165
Not significant
Pure Error
0.4067
2
0.2033
Cor Total
259.2
16
As illustrated in Table 3, the Model F-value of 33.71
implies the model is significant. There is only a 0.01%
chance that an F-value this large could occur due to
noise. p-Values less than 0.0500 indicate model terms
are significant. In this case X2, X3, X2.X3, (X1)
2 , and
(X2)
2 are significant model terms. Values greater than
0.1000 indicate the model terms are not significant.
Although X1 was not significant, it cannot be dropped
because it was part of model hierarchy. The lack-of-fit
F-value of 5.35 implies the lack-of-fit is not significant
relative to the pure error. There is a 16.50% chance that
a lack-of-fit F-value this large could occur due to noise.
The p-value for lack-of-fit was greater than 0.05 and
therefore it was not significant.
As illustrated in Table 4, the “Predicted R
2 ” of
0.8372 is in reasonable agreement with the “Adjusted
R
2 ” of 0.9485 i.e. the difference was less than 0.2.
“Adeq Precision” measures the signaltonoise ratio. A
ratio greater than 4 is desirable. In this particular case,
the ratio of 19.497 indicates an adequate signal. The
full quadratic model can therefore be used to predict
the yield as a function of selected operation variables,
Table 4. Fit statistics.
PARAMETER
VALUE
Std. Dev.
0.9138
Mean
31.05
C.V. %
2.94
R
2
0.9774
Adjusted R
2
0.9485
Predicted R
2
0.8372
Adeq Precision
19.4967
The full quadratic model is given by:
Yield, Y = −72.00930 + 2.00002 X 1 + 5.85774
X 2 + 0.042149 X 3 − 0.005657 X 1.
X 2 + (1.70384Exp − 18) X 1.
X 3 − 0.003448 X 2.X 3 − 0.018700 (X 1)
2
− 0.132977 (X 2)
2 − 0.00005 (X 3)
2
(1)
213
Std
Run
X1
X2
X3
Y1
Y2
Residual
4
1
60.0
22.0
60.0
34.1
34.75
−0.6531
1
2
40.0
13.0
60.0
27.5
27.66
−0.1627
17
3
50.0
17.5
112.5
35.8
35.4
0.396
15
4
50.0
17.5
112.5
35.4
35.4
−0.004
10
5
70.0
17.5
112.5
28.5
28.54
−0.0448
9
6
30.0
17.5
112.5
28.0
27.3
0.6968
7
7
40.0
22.0
165.0
29.4
29.96
−0.5601
2
8
60.0
13.0
60.0
29.1
29
0.0991
6
9
60.0
13.0
165.0
28.1
27.55
0.5538
14
10
50.0
17.5
200.0
32.3
32.46
−0.1553
13
11
50.0
17.5
25.0
38.4
37.59
0.8073
12
12
50.0
25.0
112.5
33.2
31.92
1.28
11
13
50.0
10.0
112.5
23.3
23.93
−0.6279
5
14
40.0
13.0
165.0
26.4
26.21
0.192
3
15
40.0
22.0
60.0
33.6
34.61
−1.01
8
16
60.0
22.0
165.0
29.8
30.1
−0.2983
16
17
50.0
17.5
112.5
34.9
35.4
−0.504
Table 3. ANOVA for response surface quadratic model.
Source
Sum of Squares
df
Mean Square
F-value
p-value
Model
253.36
9
28.15
33.71
< 0.0001
Significant
X1
1.86
1
1.86
2.23
0.1792
X2
77.1
1
77.1
92.33
< 0.0001
X3
31.86
1
31.86
38.15
0.0005
X1.X2
0.72
1
0.72
0.8622
0.384
X1.X3
1
0
0
1
X2.X3
5.12
1
5.12
6.13
0.0425
(X1)
2
78.84
1
78.84
94.41
< 0.0001
(X2)
2
78.84
1
78.84
94.41
< 0.0001
(X3)
2
0.2034
1
0.2034
0.2436
0.6367
Residual
5.85
7
0.8351
Lack of Fit
5.44
5
1.09
5.35
0.165
Not significant
Pure Error
0.4067
2
0.2033
Cor Total
259.2
16
As illustrated in Table 3, the Model F-value of 33.71
implies the model is significant. There is only a 0.01%
chance that an F-value this large could occur due to
noise. p-Values less than 0.0500 indicate model terms
are significant. In this case X2, X3, X2.X3, (X1)
2 , and
(X2)
2 are significant model terms. Values greater than
0.1000 indicate the model terms are not significant.
Although X1 was not significant, it cannot be dropped
because it was part of model hierarchy. The lack-of-fit
F-value of 5.35 implies the lack-of-fit is not significant
relative to the pure error. There is a 16.50% chance that
a lack-of-fit F-value this large could occur due to noise.
The p-value for lack-of-fit was greater than 0.05 and
therefore it was not significant.
As illustrated in Table 4, the “Predicted R
2 ” of
0.8372 is in reasonable agreement with the “Adjusted
R
2 ” of 0.9485 i.e. the difference was less than 0.2.
“Adeq Precision” measures the signaltonoise ratio. A
ratio greater than 4 is desirable. In this particular case,
the ratio of 19.497 indicates an adequate signal. The
full quadratic model can therefore be used to predict
the yield as a function of selected operation variables,
Table 4. Fit statistics.
PARAMETER
VALUE
Std. Dev.
0.9138
Mean
31.05
C.V. %
2.94
R
2
0.9774
Adjusted R
2
0.9485
Predicted R
2
0.8372
Adeq Precision
19.4967
The full quadratic model is given by:
Yield, Y = −72.00930 + 2.00002 X 1 + 5.85774
X 2 + 0.042149 X 3 − 0.005657 X 1.
X 2 + (1.70384Exp − 18) X 1.
X 3 − 0.003448 X 2.X 3 − 0.018700 (X 1)
2
− 0.132977 (X 2)
2 − 0.00005 (X 3)
2
(1)
213