

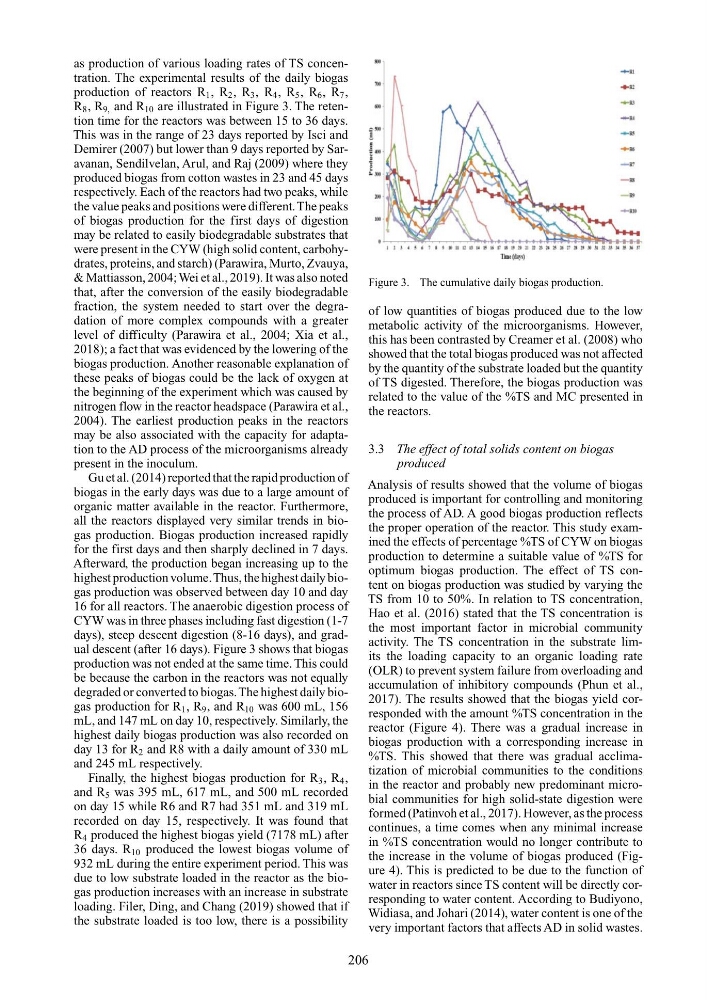
as production of various loading rates of TS concentration. The experimental results of the daily biogas
production of reactors R 1 , R 2 , R 3 , R 4 , R 5 , R 6 , R 7 ,
R 8 , R 9, and R 10 are illustrated in Figure 3. The retention time for the reactors was between 15 to 36 days.
This was in the range of 23 days reported by Isci and
Demirer (2007) but lower than 9 days reported by Saravanan, Sendilvelan, Arul, and Raj (2009) where they
produced biogas from cotton wastes in 23 and 45 days
respectively. Each of the reactors had two peaks, while
the value peaks and positions were different. The peaks
of biogas production for the first days of digestion
may be related to easily biodegradable substrates that
were present in the CYW (high solid content, carbohydrates, proteins, and starch) (Parawira, Murto, Zvauya,
& Mattiasson, 2004; Wei et al., 2019). It was also noted
that, after the conversion of the easily biodegradable
fraction, the system needed to start over the degradation of more complex compounds with a greater
level of difficulty (Parawira et al., 2004; Xia et al.,
2018); a fact that was evidenced by the lowering of the
biogas production. Another reasonable explanation of
these peaks of biogas could be the lack of oxygen at
the beginning of the experiment which was caused by
nitrogen flow in the reactor headspace (Parawira et al.,
2004). The earliest production peaks in the reactors
may be also associated with the capacity for adaptation to the AD process of the microorganisms already
present in the inoculum.
Gu et al. (2014) reported that the rapid production of
biogas in the early days was due to a large amount of
organic matter available in the reactor. Furthermore,
all the reactors displayed very similar trends in biogas production. Biogas production increased rapidly
for the first days and then sharply declined in 7 days.
Afterward, the production began increasing up to the
highest production volume.Thus, the highest daily biogas production was observed between day 10 and day
16 for all reactors. The anaerobic digestion process of
CYW was in three phases including fast digestion (1-7
days), steep descent digestion (8-16 days), and gradual descent (after 16 days). Figure 3 shows that biogas
production was not ended at the same time. This could
be because the carbon in the reactors was not equally
degraded or converted to biogas. The highest daily biogas production for R 1 , R 9 , and R 10 was 600 mL, 156
mL, and 147 mL on day 10, respectively. Similarly, the
highest daily biogas production was also recorded on
day 13 for R 2 and R8 with a daily amount of 330 mL
and 245 mL respectively.
Finally, the highest biogas production for R 3 , R 4 ,
and R 5 was 395 mL, 617 mL, and 500 mL recorded
on day 15 while R6 and R7 had 351 mL and 319 mL
recorded on day 15, respectively. It was found that
R 4 produced the highest biogas yield (7178 mL) after
36 days. R 10 produced the lowest biogas volume of
932 mL during the entire experiment period. This was
due to low substrate loaded in the reactor as the biogas production increases with an increase in substrate
loading. Filer, Ding, and Chang (2019) showed that if
the substrate loaded is too low, there is a possibility
Figure 3. The cumulative daily biogas production.
of low quantities of biogas produced due to the low
metabolic activity of the microorganisms. However,
this has been contrasted by Creamer et al. (2008) who
showed that the total biogas produced was not affected
by the quantity of the substrate loaded but the quantity
of TS digested. Therefore, the biogas production was
related to the value of the %TS and MC presented in
the reactors.
3.3 The effect of total solids content on biogas
produced
Analysis of results showed that the volume of biogas
produced is important for controlling and monitoring
the process of AD. A good biogas production reflects
the proper operation of the reactor. This study examined the effects of percentage %TS of CYW on biogas
production to determine a suitable value of %TS for
optimum biogas production. The effect of TS content on biogas production was studied by varying the
TS from 10 to 50%. In relation to TS concentration,
Hao et al. (2016) stated that the TS concentration is
the most important factor in microbial community
activity. The TS concentration in the substrate limits the loading capacity to an organic loading rate
(OLR) to prevent system failure from overloading and
accumulation of inhibitory compounds (Phun et al.,
2017). The results showed that the biogas yield corresponded with the amount %TS concentration in the
reactor (Figure 4). There was a gradual increase in
biogas production with a corresponding increase in
%TS. This showed that there was gradual acclimatization of microbial communities to the conditions
in the reactor and probably new predominant microbial communities for high solid-state digestion were
formed (Patinvoh et al., 2017). However, as the process
continues, a time comes when any minimal increase
in %TS concentration would no longer contribute to
the increase in the volume of biogas produced (Figure 4). This is predicted to be due to the function of
water in reactors since TS content will be directly corresponding to water content. According to Budiyono,
Widiasa, and Johari (2014), water content is one of the
very important factors that affects AD in solid wastes.
206
production of reactors R 1 , R 2 , R 3 , R 4 , R 5 , R 6 , R 7 ,
R 8 , R 9, and R 10 are illustrated in Figure 3. The retention time for the reactors was between 15 to 36 days.
This was in the range of 23 days reported by Isci and
Demirer (2007) but lower than 9 days reported by Saravanan, Sendilvelan, Arul, and Raj (2009) where they
produced biogas from cotton wastes in 23 and 45 days
respectively. Each of the reactors had two peaks, while
the value peaks and positions were different. The peaks
of biogas production for the first days of digestion
may be related to easily biodegradable substrates that
were present in the CYW (high solid content, carbohydrates, proteins, and starch) (Parawira, Murto, Zvauya,
& Mattiasson, 2004; Wei et al., 2019). It was also noted
that, after the conversion of the easily biodegradable
fraction, the system needed to start over the degradation of more complex compounds with a greater
level of difficulty (Parawira et al., 2004; Xia et al.,
2018); a fact that was evidenced by the lowering of the
biogas production. Another reasonable explanation of
these peaks of biogas could be the lack of oxygen at
the beginning of the experiment which was caused by
nitrogen flow in the reactor headspace (Parawira et al.,
2004). The earliest production peaks in the reactors
may be also associated with the capacity for adaptation to the AD process of the microorganisms already
present in the inoculum.
Gu et al. (2014) reported that the rapid production of
biogas in the early days was due to a large amount of
organic matter available in the reactor. Furthermore,
all the reactors displayed very similar trends in biogas production. Biogas production increased rapidly
for the first days and then sharply declined in 7 days.
Afterward, the production began increasing up to the
highest production volume.Thus, the highest daily biogas production was observed between day 10 and day
16 for all reactors. The anaerobic digestion process of
CYW was in three phases including fast digestion (1-7
days), steep descent digestion (8-16 days), and gradual descent (after 16 days). Figure 3 shows that biogas
production was not ended at the same time. This could
be because the carbon in the reactors was not equally
degraded or converted to biogas. The highest daily biogas production for R 1 , R 9 , and R 10 was 600 mL, 156
mL, and 147 mL on day 10, respectively. Similarly, the
highest daily biogas production was also recorded on
day 13 for R 2 and R8 with a daily amount of 330 mL
and 245 mL respectively.
Finally, the highest biogas production for R 3 , R 4 ,
and R 5 was 395 mL, 617 mL, and 500 mL recorded
on day 15 while R6 and R7 had 351 mL and 319 mL
recorded on day 15, respectively. It was found that
R 4 produced the highest biogas yield (7178 mL) after
36 days. R 10 produced the lowest biogas volume of
932 mL during the entire experiment period. This was
due to low substrate loaded in the reactor as the biogas production increases with an increase in substrate
loading. Filer, Ding, and Chang (2019) showed that if
the substrate loaded is too low, there is a possibility
Figure 3. The cumulative daily biogas production.
of low quantities of biogas produced due to the low
metabolic activity of the microorganisms. However,
this has been contrasted by Creamer et al. (2008) who
showed that the total biogas produced was not affected
by the quantity of the substrate loaded but the quantity
of TS digested. Therefore, the biogas production was
related to the value of the %TS and MC presented in
the reactors.
3.3 The effect of total solids content on biogas
produced
Analysis of results showed that the volume of biogas
produced is important for controlling and monitoring
the process of AD. A good biogas production reflects
the proper operation of the reactor. This study examined the effects of percentage %TS of CYW on biogas
production to determine a suitable value of %TS for
optimum biogas production. The effect of TS content on biogas production was studied by varying the
TS from 10 to 50%. In relation to TS concentration,
Hao et al. (2016) stated that the TS concentration is
the most important factor in microbial community
activity. The TS concentration in the substrate limits the loading capacity to an organic loading rate
(OLR) to prevent system failure from overloading and
accumulation of inhibitory compounds (Phun et al.,
2017). The results showed that the biogas yield corresponded with the amount %TS concentration in the
reactor (Figure 4). There was a gradual increase in
biogas production with a corresponding increase in
%TS. This showed that there was gradual acclimatization of microbial communities to the conditions
in the reactor and probably new predominant microbial communities for high solid-state digestion were
formed (Patinvoh et al., 2017). However, as the process
continues, a time comes when any minimal increase
in %TS concentration would no longer contribute to
the increase in the volume of biogas produced (Figure 4). This is predicted to be due to the function of
water in reactors since TS content will be directly corresponding to water content. According to Budiyono,
Widiasa, and Johari (2014), water content is one of the
very important factors that affects AD in solid wastes.
206