

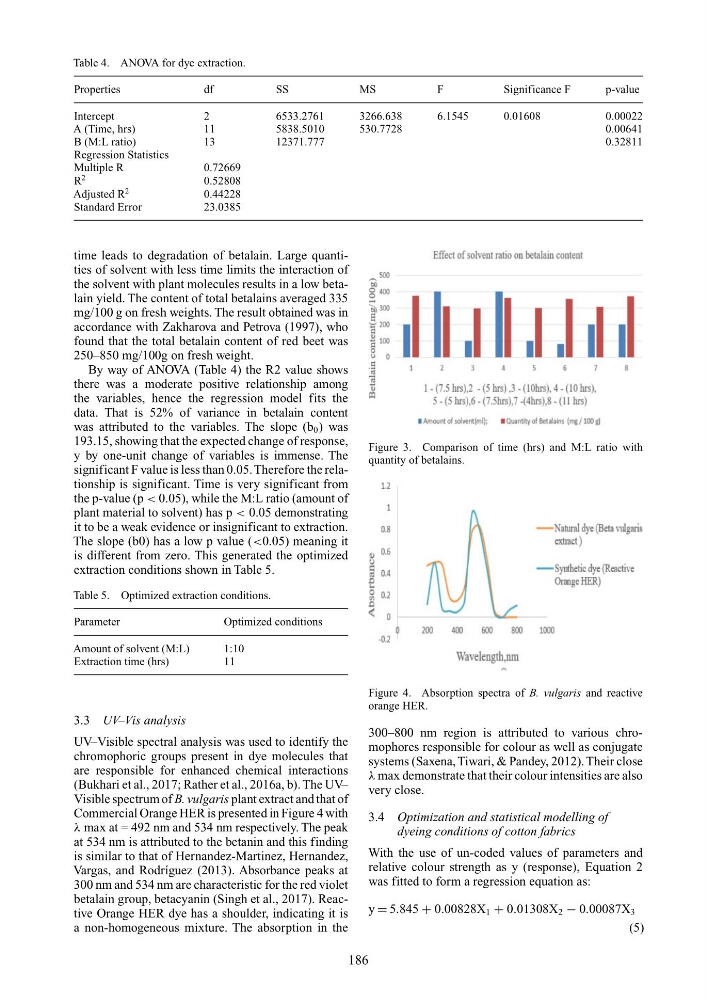
Table 4. ANOVA for dye extraction.
Properties
df
SS
MS
F
Significance F
p-value
Intercept
2
6533.2761
3266.638
6.1545
0.01608
0.00022
A (Time, hrs)
11
5838.5010
530.7728
0.00641
B (M:L ratio)
13
12371.777
0.32811
Regression Statistics
Multiple R
0.72669
R
2
0.52808
Adjusted R
2
0.44228
Standard Error
23.0385
time leads to degradation of betalain. Large quantities of solvent with less time limits the interaction of
the solvent with plant molecules results in a low betalain yield. The content of total betalains averaged 335
mg/100 g on fresh weights. The result obtained was in
accordance with Zakharova and Petrova (1997), who
found that the total betalain content of red beet was
250–850 mg/100g on fresh weight.
By way of ANOVA (Table 4) the R2 value shows
there was a moderate positive relationship among
the variables, hence the regression model fits the
data. That is 52% of variance in betalain content
was attributed to the variables. The slope (b 0 ) was
193.15, showing that the expected change of response,
y by one-unit change of variables is immense. The
significant F value is less than 0.05. Therefore the relationship is significant. Time is very significant from
the p-value (p < 0.05), while the M:L ratio (amount of
plant material to solvent) has p < 0.05 demonstrating
it to be a weak evidence or insignificant to extraction.
The slope (b0) has a low p value (<0.05) meaning it
is different from zero. This generated the optimized
extraction conditions shown in Table 5.
Table 5. Optimized extraction conditions.
Parameter
Optimized conditions
Amount of solvent (M:L)
1:10
Extraction time (hrs)
11
3.3 UV–Vis analysis
UV–Visible spectral analysis was used to identify the
chromophoric groups present in dye molecules that
are responsible for enhanced chemical interactions
(Bukhari et al., 2017; Rather et al., 2016a, b). The UV–
Visible spectrum of B. vulgaris plant extract and that of
Commercial Orange HER is presented in Figure 4 with
λ max at = 492 nm and 534 nm respectively. The peak
at 534 nm is attributed to the betanin and this finding
is similar to that of Hernandez-Martinez, Hernandez,
Vargas, and Rodríguez (2013). Absorbance peaks at
300 nm and 534 nm are characteristic for the red violet
betalain group, betacyanin (Singh et al., 2017). Reactive Orange HER dye has a shoulder, indicating it is
a non-homogeneous mixture. The absorption in the
Figure 3. Comparison of time (hrs) and M:L ratio with
quantity of betalains.
Figure 4. Absorption spectra of B. vulgaris and reactive
orange HER.
300–800 nm region is attributed to various chromophores responsible for colour as well as conjugate
systems (Saxena, Tiwari, & Pandey, 2012). Their close
λ max demonstrate that their colour intensities are also
very close.
3.4 Optimization and statistical modelling of
dyeing conditions of cotton fabrics
With the use of un-coded values of parameters and
relative colour strength as y (response), Equation 2
was fitted to form a regression equation as:
y = 5.845 + 0.00828X 1 + 0.01308X 2 − 0.00087X 3
(5)
186
Properties
df
SS
MS
F
Significance F
p-value
Intercept
2
6533.2761
3266.638
6.1545
0.01608
0.00022
A (Time, hrs)
11
5838.5010
530.7728
0.00641
B (M:L ratio)
13
12371.777
0.32811
Regression Statistics
Multiple R
0.72669
R
2
0.52808
Adjusted R
2
0.44228
Standard Error
23.0385
time leads to degradation of betalain. Large quantities of solvent with less time limits the interaction of
the solvent with plant molecules results in a low betalain yield. The content of total betalains averaged 335
mg/100 g on fresh weights. The result obtained was in
accordance with Zakharova and Petrova (1997), who
found that the total betalain content of red beet was
250–850 mg/100g on fresh weight.
By way of ANOVA (Table 4) the R2 value shows
there was a moderate positive relationship among
the variables, hence the regression model fits the
data. That is 52% of variance in betalain content
was attributed to the variables. The slope (b 0 ) was
193.15, showing that the expected change of response,
y by one-unit change of variables is immense. The
significant F value is less than 0.05. Therefore the relationship is significant. Time is very significant from
the p-value (p < 0.05), while the M:L ratio (amount of
plant material to solvent) has p < 0.05 demonstrating
it to be a weak evidence or insignificant to extraction.
The slope (b0) has a low p value (<0.05) meaning it
is different from zero. This generated the optimized
extraction conditions shown in Table 5.
Table 5. Optimized extraction conditions.
Parameter
Optimized conditions
Amount of solvent (M:L)
1:10
Extraction time (hrs)
11
3.3 UV–Vis analysis
UV–Visible spectral analysis was used to identify the
chromophoric groups present in dye molecules that
are responsible for enhanced chemical interactions
(Bukhari et al., 2017; Rather et al., 2016a, b). The UV–
Visible spectrum of B. vulgaris plant extract and that of
Commercial Orange HER is presented in Figure 4 with
λ max at = 492 nm and 534 nm respectively. The peak
at 534 nm is attributed to the betanin and this finding
is similar to that of Hernandez-Martinez, Hernandez,
Vargas, and Rodríguez (2013). Absorbance peaks at
300 nm and 534 nm are characteristic for the red violet
betalain group, betacyanin (Singh et al., 2017). Reactive Orange HER dye has a shoulder, indicating it is
a non-homogeneous mixture. The absorption in the
Figure 3. Comparison of time (hrs) and M:L ratio with
quantity of betalains.
Figure 4. Absorption spectra of B. vulgaris and reactive
orange HER.
300–800 nm region is attributed to various chromophores responsible for colour as well as conjugate
systems (Saxena, Tiwari, & Pandey, 2012). Their close
λ max demonstrate that their colour intensities are also
very close.
3.4 Optimization and statistical modelling of
dyeing conditions of cotton fabrics
With the use of un-coded values of parameters and
relative colour strength as y (response), Equation 2
was fitted to form a regression equation as:
y = 5.845 + 0.00828X 1 + 0.01308X 2 − 0.00087X 3
(5)
186