

2.9 Estimation of colour strength equivalence,
(Ceq)
Colour strength equivalence between the natural dye
and Reactive Orange HER synthetic dye was estimated
by using Equation (3) (Bechtold, et al., 2006).
Ceq =
Aextr
ε RO84d
(3)
where Ceq is colour strength equivalence of Reactive
Orange HER (g dm-3); Aextr is absorbance of dye
plant extract; εRO84 is extinction coefficient of Reactive orange HER (7.94 dm
3 cm
−1 g
−1 at λ = 491 nm);
and d is path length of cuvette (cm). The absorbance
value for the natural dye (Aextr) was multiplied by the
corresponding dilution factor (DF).
2.10 Colour fastness properties tests
The colour fastness to washing and light of
pre-conditioned dyed cotton fabrics was determined according to American Association of Textile
Chemists and Colourists (AATCC) Test Method 61
(2009) and AATCC Test Method 16 (2004), respectively. Colour fastness to crocking of dyed cotton
fabrics (dry and wet rubbing) and perspiration (alkaline and acidic) were determined according to AATCC
Test Method 8 (2001).
2.11 Evaluation of CIELab colour coordinates
The characteristic CIELab colour coordinates, that is
(light/darkness (L*), tones (a* & b*), and E*ab of
the 10 cm
2 dyed samples were determined by SP60X
spectrophotometer colour meter (Khan, Hussain, &
Jiang, 2018). Both unmordanted and mordanted natural dyed cellulosic fabrics were automatically illuminated under D65 10 as described by Rather et al.
(2016).
3 RESULTS AND DISCUSSION
3.1 Response surface and optimization of
extraction conditions
The interaction of adsorbents (dyes and mordants) with
the adsorbent materials (cotton fibre) is discussed in
this study. Optimization is critical to determine the best
Table 3. Central composite design for betalain pigment quantification.
Amount of
Extraction
solvent (ml);
time
A max,
Betalains
Yield
Runs
(M:L Ratio)
(hrs)
535–537 nm
(mg/100 g)
(%)
1
200
7.5
0.82
375
51.12
2
400
5
0.68
311
35.2
3
100
10
0.65
297.9
34.5
4
400
10
0.79
362
52.8
5
100
5
0.66
302.5
33.6
6
80
7.5
0.78
357.5
34.2
7
200
4
0.67
307
30.8
8
200
11
0.81
371.3
53.25
adsorption design mechanism pathways and systems
(Rather et al., 2016).
The plant powder quantity (20 g) and pH (4) value
were applied constantly in all the runs. Fitting equation (2) betanine as a function of independent variable
using time (X1) of extraction and M:L ratio (X2)
response, y (yield/betanine) was obtained in a linear
model as;
y = 193.15 + 13.66X 1 + 1.11X 2
(4)
3.2 Effect of time and M:L ratio on extraction yield
and total betalain content
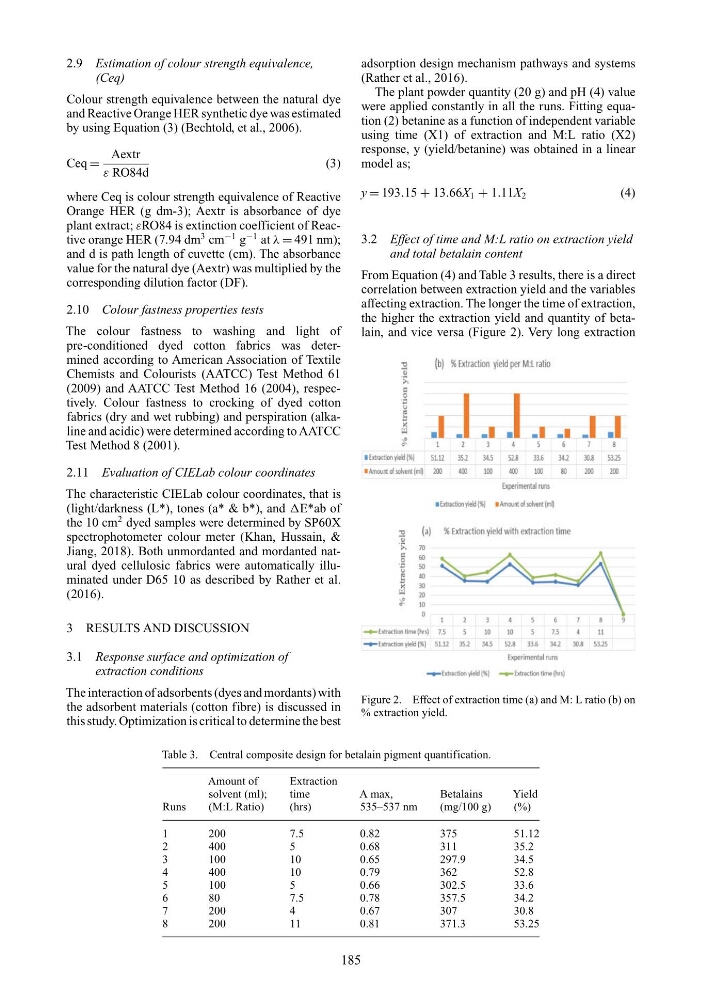
From Equation (4) and Table 3 results, there is a direct
correlation between extraction yield and the variables
affecting extraction. The longer the time of extraction,
the higher the extraction yield and quantity of betalain, and vice versa (Figure 2). Very long extraction
Figure 2. Effect of extraction time (a) and M: L ratio (b) on
% extraction yield.
185
(Ceq)
Colour strength equivalence between the natural dye
and Reactive Orange HER synthetic dye was estimated
by using Equation (3) (Bechtold, et al., 2006).
Ceq =
Aextr
ε RO84d
(3)
where Ceq is colour strength equivalence of Reactive
Orange HER (g dm-3); Aextr is absorbance of dye
plant extract; εRO84 is extinction coefficient of Reactive orange HER (7.94 dm
3 cm
−1 g
−1 at λ = 491 nm);
and d is path length of cuvette (cm). The absorbance
value for the natural dye (Aextr) was multiplied by the
corresponding dilution factor (DF).
2.10 Colour fastness properties tests
The colour fastness to washing and light of
pre-conditioned dyed cotton fabrics was determined according to American Association of Textile
Chemists and Colourists (AATCC) Test Method 61
(2009) and AATCC Test Method 16 (2004), respectively. Colour fastness to crocking of dyed cotton
fabrics (dry and wet rubbing) and perspiration (alkaline and acidic) were determined according to AATCC
Test Method 8 (2001).
2.11 Evaluation of CIELab colour coordinates
The characteristic CIELab colour coordinates, that is
(light/darkness (L*), tones (a* & b*), and E*ab of
the 10 cm
2 dyed samples were determined by SP60X
spectrophotometer colour meter (Khan, Hussain, &
Jiang, 2018). Both unmordanted and mordanted natural dyed cellulosic fabrics were automatically illuminated under D65 10 as described by Rather et al.
(2016).
3 RESULTS AND DISCUSSION
3.1 Response surface and optimization of
extraction conditions
The interaction of adsorbents (dyes and mordants) with
the adsorbent materials (cotton fibre) is discussed in
this study. Optimization is critical to determine the best
Table 3. Central composite design for betalain pigment quantification.
Amount of
Extraction
solvent (ml);
time
A max,
Betalains
Yield
Runs
(M:L Ratio)
(hrs)
535–537 nm
(mg/100 g)
(%)
1
200
7.5
0.82
375
51.12
2
400
5
0.68
311
35.2
3
100
10
0.65
297.9
34.5
4
400
10
0.79
362
52.8
5
100
5
0.66
302.5
33.6
6
80
7.5
0.78
357.5
34.2
7
200
4
0.67
307
30.8
8
200
11
0.81
371.3
53.25
adsorption design mechanism pathways and systems
(Rather et al., 2016).
The plant powder quantity (20 g) and pH (4) value
were applied constantly in all the runs. Fitting equation (2) betanine as a function of independent variable
using time (X1) of extraction and M:L ratio (X2)
response, y (yield/betanine) was obtained in a linear
model as;
y = 193.15 + 13.66X 1 + 1.11X 2
(4)
3.2 Effect of time and M:L ratio on extraction yield
and total betalain content
From Equation (4) and Table 3 results, there is a direct
correlation between extraction yield and the variables
affecting extraction. The longer the time of extraction,
the higher the extraction yield and quantity of betalain, and vice versa (Figure 2). Very long extraction
Figure 2. Effect of extraction time (a) and M: L ratio (b) on
% extraction yield.
185