

fabric sample cutter/swatch master, absorbency spray
master, dyeing water bath, 5 L colour matching
booth, motorized crock master, MBTL sun master
(Paramount Instruments Pvt Ltd, India) and Perspirometer (SDL Atlas, USA), SP60 Spectrophotometer (X-Rite, USA).
2.3 Selection of the extraction experimental
variables and statistical modelling
Two experimental variables, i.e., time of dye extraction
and material to liquor ratio (M:L) were considered in
extraction. The experimental variables and their levels
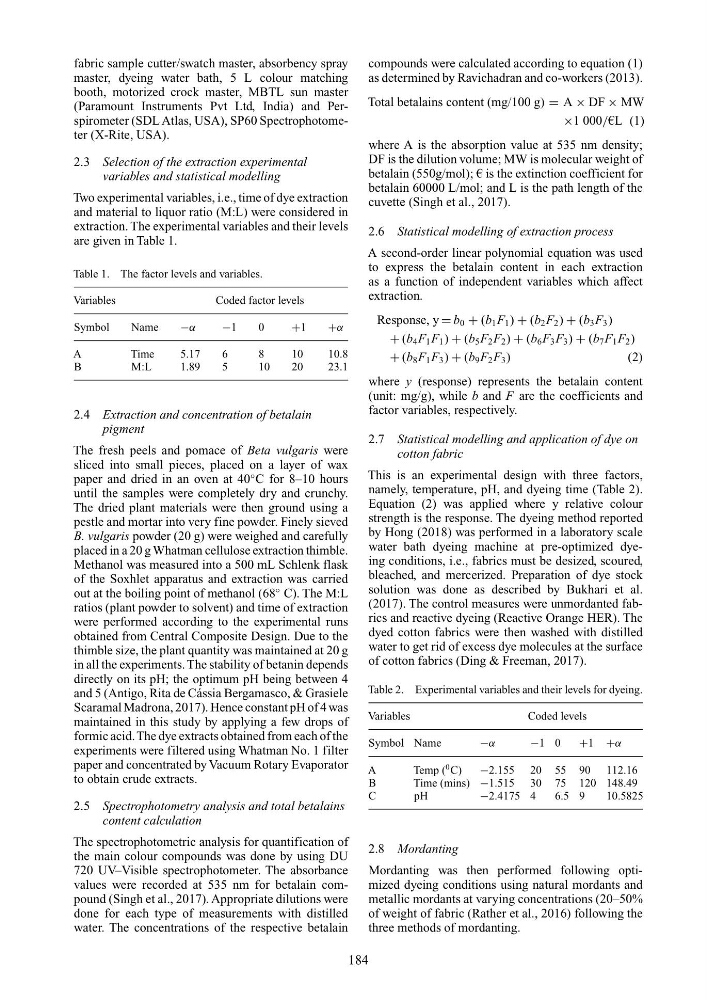
are given in Table 1.
Table 1. The factor levels and variables.
Variables
Coded factor levels
Symbol
Name
−α
−1
0
+1
+α
A
Time
5.17
6
8
10
10.8
B
M:L
1.89
5
10
20
23.1
2.4 Extraction and concentration of betalain
pigment
The fresh peels and pomace of Beta vulgaris were
sliced into small pieces, placed on a layer of wax
paper and dried in an oven at 40
◦ C for 8–10 hours
until the samples were completely dry and crunchy.
The dried plant materials were then ground using a
pestle and mortar into very fine powder. Finely sieved
B. vulgaris powder (20 g) were weighed and carefully
placed in a 20 g Whatman cellulose extraction thimble.
Methanol was measured into a 500 mL Schlenk flask
of the Soxhlet apparatus and extraction was carried
out at the boiling point of methanol (68
◦ C). The M:L
ratios (plant powder to solvent) and time of extraction
were performed according to the experimental runs
obtained from Central Composite Design. Due to the
thimble size, the plant quantity was maintained at 20 g
in all the experiments. The stability of betanin depends
directly on its pH; the optimum pH being between 4
and 5 (Antigo, Rita de Cássia Bergamasco, & Grasiele
Scaramal Madrona, 2017). Hence constant pH of 4 was
maintained in this study by applying a few drops of
formic acid. The dye extracts obtained from each of the
experiments were filtered using Whatman No. 1 filter
paper and concentrated by Vacuum Rotary Evaporator
to obtain crude extracts.
2.5 Spectrophotometry analysis and total betalains
content calculation
The spectrophotometric analysis for quantification of
the main colour compounds was done by using DU
720 UV–Visible spectrophotometer. The absorbance
values were recorded at 535 nm for betalain compound (Singh et al., 2017). Appropriate dilutions were
done for each type of measurements with distilled
water. The concentrations of the respective betalain
compounds were calculated according to equation (1)
as determined by Ravichadran and co-workers (2013).
Total betalains content (mg/100 g) = A × DF × MW
×1 000/€L (1)
where A is the absorption value at 535 nm density;
DF is the dilution volume; MW is molecular weight of
betalain (550g/mol); € is the extinction coefficient for
betalain 60000 L/mol; and L is the path length of the
cuvette (Singh et al., 2017).
2.6 Statistical modelling of extraction process
A second-order linear polynomial equation was used
to express the betalain content in each extraction
as a function of independent variables which affect
extraction.
Response, y = b 0 + (b 1 F 1 ) + (b 2 F 2 ) + (b 3 F 3 )
+ (b 4 F 1 F 1 ) + (b 5 F 2 F 2 ) + (b 6 F 3 F 3 ) + (b 7 F 1 F 2 )
+ (b 8 F 1 F 3 ) + (b 9 F 2 F 3 )
(2)
where y (response) represents the betalain content
(unit: mg/g), while b and F are the coefficients and
factor variables, respectively.
2.7 Statistical modelling and application of dye on
cotton fabric
This is an experimental design with three factors,
namely, temperature, pH, and dyeing time (Table 2).
Equation (2) was applied where y relative colour
strength is the response. The dyeing method reported
by Hong (2018) was performed in a laboratory scale
water bath dyeing machine at pre-optimized dyeing conditions, i.e., fabrics must be desized, scoured,
bleached, and mercerized. Preparation of dye stock
solution was done as described by Bukhari et al.
(2017). The control measures were unmordanted fabrics and reactive dyeing (Reactive Orange HER). The
dyed cotton fabrics were then washed with distilled
water to get rid of excess dye molecules at the surface
of cotton fabrics (Ding & Freeman, 2017).
Table 2. Experimental variables and their levels for dyeing.
Variables
Coded levels
Symbol Name
−α
−1 0
+1 +α
A
Temp (
0 C)
−2.155 20 55 90 112.16
B
Time (mins) −1.515 30 75 120 148.49
C
p H
−2.4175 4
6.5 9
10.5825
2.8 Mordanting
Mordanting was then performed following optimized dyeing conditions using natural mordants and
metallic mordants at varying concentrations (20–50%
of weight of fabric (Rather et al., 2016) following the
three methods of mordanting.
184
master, dyeing water bath, 5 L colour matching
booth, motorized crock master, MBTL sun master
(Paramount Instruments Pvt Ltd, India) and Perspirometer (SDL Atlas, USA), SP60 Spectrophotometer (X-Rite, USA).
2.3 Selection of the extraction experimental
variables and statistical modelling
Two experimental variables, i.e., time of dye extraction
and material to liquor ratio (M:L) were considered in
extraction. The experimental variables and their levels
are given in Table 1.
Table 1. The factor levels and variables.
Variables
Coded factor levels
Symbol
Name
−α
−1
0
+1
+α
A
Time
5.17
6
8
10
10.8
B
M:L
1.89
5
10
20
23.1
2.4 Extraction and concentration of betalain
pigment
The fresh peels and pomace of Beta vulgaris were
sliced into small pieces, placed on a layer of wax
paper and dried in an oven at 40
◦ C for 8–10 hours
until the samples were completely dry and crunchy.
The dried plant materials were then ground using a
pestle and mortar into very fine powder. Finely sieved
B. vulgaris powder (20 g) were weighed and carefully
placed in a 20 g Whatman cellulose extraction thimble.
Methanol was measured into a 500 mL Schlenk flask
of the Soxhlet apparatus and extraction was carried
out at the boiling point of methanol (68
◦ C). The M:L
ratios (plant powder to solvent) and time of extraction
were performed according to the experimental runs
obtained from Central Composite Design. Due to the
thimble size, the plant quantity was maintained at 20 g
in all the experiments. The stability of betanin depends
directly on its pH; the optimum pH being between 4
and 5 (Antigo, Rita de Cássia Bergamasco, & Grasiele
Scaramal Madrona, 2017). Hence constant pH of 4 was
maintained in this study by applying a few drops of
formic acid. The dye extracts obtained from each of the
experiments were filtered using Whatman No. 1 filter
paper and concentrated by Vacuum Rotary Evaporator
to obtain crude extracts.
2.5 Spectrophotometry analysis and total betalains
content calculation
The spectrophotometric analysis for quantification of
the main colour compounds was done by using DU
720 UV–Visible spectrophotometer. The absorbance
values were recorded at 535 nm for betalain compound (Singh et al., 2017). Appropriate dilutions were
done for each type of measurements with distilled
water. The concentrations of the respective betalain
compounds were calculated according to equation (1)
as determined by Ravichadran and co-workers (2013).
Total betalains content (mg/100 g) = A × DF × MW
×1 000/€L (1)
where A is the absorption value at 535 nm density;
DF is the dilution volume; MW is molecular weight of
betalain (550g/mol); € is the extinction coefficient for
betalain 60000 L/mol; and L is the path length of the
cuvette (Singh et al., 2017).
2.6 Statistical modelling of extraction process
A second-order linear polynomial equation was used
to express the betalain content in each extraction
as a function of independent variables which affect
extraction.
Response, y = b 0 + (b 1 F 1 ) + (b 2 F 2 ) + (b 3 F 3 )
+ (b 4 F 1 F 1 ) + (b 5 F 2 F 2 ) + (b 6 F 3 F 3 ) + (b 7 F 1 F 2 )
+ (b 8 F 1 F 3 ) + (b 9 F 2 F 3 )
(2)
where y (response) represents the betalain content
(unit: mg/g), while b and F are the coefficients and
factor variables, respectively.
2.7 Statistical modelling and application of dye on
cotton fabric
This is an experimental design with three factors,
namely, temperature, pH, and dyeing time (Table 2).
Equation (2) was applied where y relative colour
strength is the response. The dyeing method reported
by Hong (2018) was performed in a laboratory scale
water bath dyeing machine at pre-optimized dyeing conditions, i.e., fabrics must be desized, scoured,
bleached, and mercerized. Preparation of dye stock
solution was done as described by Bukhari et al.
(2017). The control measures were unmordanted fabrics and reactive dyeing (Reactive Orange HER). The
dyed cotton fabrics were then washed with distilled
water to get rid of excess dye molecules at the surface
of cotton fabrics (Ding & Freeman, 2017).
Table 2. Experimental variables and their levels for dyeing.
Variables
Coded levels
Symbol Name
−α
−1 0
+1 +α
A
Temp (
0 C)
−2.155 20 55 90 112.16
B
Time (mins) −1.515 30 75 120 148.49
C
p H
−2.4175 4
6.5 9
10.5825
2.8 Mordanting
Mordanting was then performed following optimized dyeing conditions using natural mordants and
metallic mordants at varying concentrations (20–50%
of weight of fabric (Rather et al., 2016) following the
three methods of mordanting.
184