

3.3 Evaluation of the dyed fabric
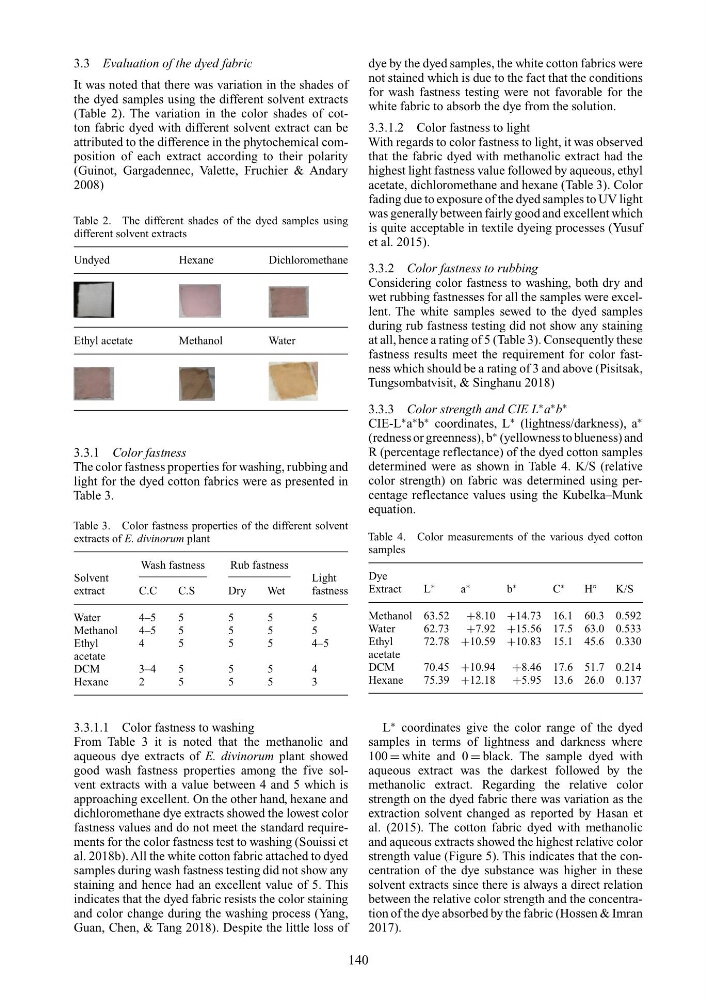
It was noted that there was variation in the shades of
the dyed samples using the different solvent extracts
(Table 2). The variation in the color shades of cotton fabric dyed with different solvent extract can be
attributed to the difference in the phytochemical composition of each extract according to their polarity
(Guinot, Gargadennec, Valette, Fruchier & Andary
2008)
Table 2. The different shades of the dyed samples using
different solvent extracts
Undyed
Hexane
Dichloromethane
Ethyl acetate
Methanol
Water
3.3.1 Color fastness
The color fastness properties for washing, rubbing and
light for the dyed cotton fabrics were as presented in
Table 3.
Table 3. Color fastness properties of the different solvent
extracts of E. divinorum plant
Wash fastness
Rub fastness
Solvent
Light
extract
C.C
C.S
Dry
Wet
fastness
Water
4–5
5
5
5
5
Methanol
4–5
5
5
5
5
Ethyl
4
5
5
5
4–5
acetate
DCM
3–4
5
5
5
4
Hexane
2
5
5
5
3
3.3.1.1 Color fastness to washing
From Table 3 it is noted that the methanolic and
aqueous dye extracts of E. divinorum plant showed
good wash fastness properties among the five solvent extracts with a value between 4 and 5 which is
approaching excellent. On the other hand, hexane and
dichloromethane dye extracts showed the lowest color
fastness values and do not meet the standard requirements for the color fastness test to washing (Souissi et
al. 2018b). All the white cotton fabric attached to dyed
samples during wash fastness testing did not show any
staining and hence had an excellent value of 5. This
indicates that the dyed fabric resists the color staining
and color change during the washing process (Yang,
Guan, Chen, & Tang 2018). Despite the little loss of
dye by the dyed samples, the white cotton fabrics were
not stained which is due to the fact that the conditions
for wash fastness testing were not favorable for the
white fabric to absorb the dye from the solution.
3.3.1.2 Color fastness to light
With regards to color fastness to light, it was observed
that the fabric dyed with methanolic extract had the
highest light fastness value followed by aqueous, ethyl
acetate, dichloromethane and hexane (Table 3). Color
fading due to exposure of the dyed samples to UV light
was generally between fairly good and excellent which
is quite acceptable in textile dyeing processes (Yusuf
et al. 2015).
3.3.2 Color fastness to rubbing
Considering color fastness to washing, both dry and
wet rubbing fastnesses for all the samples were excellent. The white samples sewed to the dyed samples
during rub fastness testing did not show any staining
at all, hence a rating of 5 (Table 3). Consequently these
fastness results meet the requirement for color fastness which should be a rating of 3 and above (Pisitsak,
Tungsombatvisit, & Singhanu 2018)
3.3.3 Color strength and CIE L
∗ a
∗ b
∗
CIE-L
∗ a
∗ b
∗ coordinates, L
∗ (lightness/darkness), a
∗
(redness or greenness), b
∗ (yellowness to blueness) and
R (percentage reflectance) of the dyed cotton samples
determined were as shown in Table 4. K/S (relative
color strength) on fabric was determined using percentage reflectance values using the Kubelka–Munk
equation.
Table 4. Color measurements of the various dyed cotton
samples
Dye
Extract
L
∗
a
∗
b
∗
C
∗
H
◦
K/S
Methanol 63.52 +8.10 +14.73 16.1 60.3 0.592
Water
62.73 +7.92 +15.56 17.5 63.0 0.533
Ethyl
72.78 +10.59 +10.83 15.1 45.6 0.330
acetate
DCM
70.45 +10.94 +8.46 17.6 51.7 0.214
Hexane
75.39 +12.18 +5.95 13.6 26.0 0.137
L
∗ coordinates give the color range of the dyed
samples in terms of lightness and darkness where
100 = white and 0 = black. The sample dyed with
aqueous extract was the darkest followed by the
methanolic extract. Regarding the relative color
strength on the dyed fabric there was variation as the
extraction solvent changed as reported by Hasan et
al. (2015). The cotton fabric dyed with methanolic
and aqueous extracts showed the highest relative color
strength value (Figure 5). This indicates that the concentration of the dye substance was higher in these
solvent extracts since there is always a direct relation
between the relative color strength and the concentration of the dye absorbed by the fabric (Hossen & Imran
2017).
140
It was noted that there was variation in the shades of
the dyed samples using the different solvent extracts
(Table 2). The variation in the color shades of cotton fabric dyed with different solvent extract can be
attributed to the difference in the phytochemical composition of each extract according to their polarity
(Guinot, Gargadennec, Valette, Fruchier & Andary
2008)
Table 2. The different shades of the dyed samples using
different solvent extracts
Undyed
Hexane
Dichloromethane
Ethyl acetate
Methanol
Water
3.3.1 Color fastness
The color fastness properties for washing, rubbing and
light for the dyed cotton fabrics were as presented in
Table 3.
Table 3. Color fastness properties of the different solvent
extracts of E. divinorum plant
Wash fastness
Rub fastness
Solvent
Light
extract
C.C
C.S
Dry
Wet
fastness
Water
4–5
5
5
5
5
Methanol
4–5
5
5
5
5
Ethyl
4
5
5
5
4–5
acetate
DCM
3–4
5
5
5
4
Hexane
2
5
5
5
3
3.3.1.1 Color fastness to washing
From Table 3 it is noted that the methanolic and
aqueous dye extracts of E. divinorum plant showed
good wash fastness properties among the five solvent extracts with a value between 4 and 5 which is
approaching excellent. On the other hand, hexane and
dichloromethane dye extracts showed the lowest color
fastness values and do not meet the standard requirements for the color fastness test to washing (Souissi et
al. 2018b). All the white cotton fabric attached to dyed
samples during wash fastness testing did not show any
staining and hence had an excellent value of 5. This
indicates that the dyed fabric resists the color staining
and color change during the washing process (Yang,
Guan, Chen, & Tang 2018). Despite the little loss of
dye by the dyed samples, the white cotton fabrics were
not stained which is due to the fact that the conditions
for wash fastness testing were not favorable for the
white fabric to absorb the dye from the solution.
3.3.1.2 Color fastness to light
With regards to color fastness to light, it was observed
that the fabric dyed with methanolic extract had the
highest light fastness value followed by aqueous, ethyl
acetate, dichloromethane and hexane (Table 3). Color
fading due to exposure of the dyed samples to UV light
was generally between fairly good and excellent which
is quite acceptable in textile dyeing processes (Yusuf
et al. 2015).
3.3.2 Color fastness to rubbing
Considering color fastness to washing, both dry and
wet rubbing fastnesses for all the samples were excellent. The white samples sewed to the dyed samples
during rub fastness testing did not show any staining
at all, hence a rating of 5 (Table 3). Consequently these
fastness results meet the requirement for color fastness which should be a rating of 3 and above (Pisitsak,
Tungsombatvisit, & Singhanu 2018)
3.3.3 Color strength and CIE L
∗ a
∗ b
∗
CIE-L
∗ a
∗ b
∗ coordinates, L
∗ (lightness/darkness), a
∗
(redness or greenness), b
∗ (yellowness to blueness) and
R (percentage reflectance) of the dyed cotton samples
determined were as shown in Table 4. K/S (relative
color strength) on fabric was determined using percentage reflectance values using the Kubelka–Munk
equation.
Table 4. Color measurements of the various dyed cotton
samples
Dye
Extract
L
∗
a
∗
b
∗
C
∗
H
◦
K/S
Methanol 63.52 +8.10 +14.73 16.1 60.3 0.592
Water
62.73 +7.92 +15.56 17.5 63.0 0.533
Ethyl
72.78 +10.59 +10.83 15.1 45.6 0.330
acetate
DCM
70.45 +10.94 +8.46 17.6 51.7 0.214
Hexane
75.39 +12.18 +5.95 13.6 26.0 0.137
L
∗ coordinates give the color range of the dyed
samples in terms of lightness and darkness where
100 = white and 0 = black. The sample dyed with
aqueous extract was the darkest followed by the
methanolic extract. Regarding the relative color
strength on the dyed fabric there was variation as the
extraction solvent changed as reported by Hasan et
al. (2015). The cotton fabric dyed with methanolic
and aqueous extracts showed the highest relative color
strength value (Figure 5). This indicates that the concentration of the dye substance was higher in these
solvent extracts since there is always a direct relation
between the relative color strength and the concentration of the dye absorbed by the fabric (Hossen & Imran
2017).
140