

3.2 Quantitative phytochemical analysis
3.2.1 Total tannins
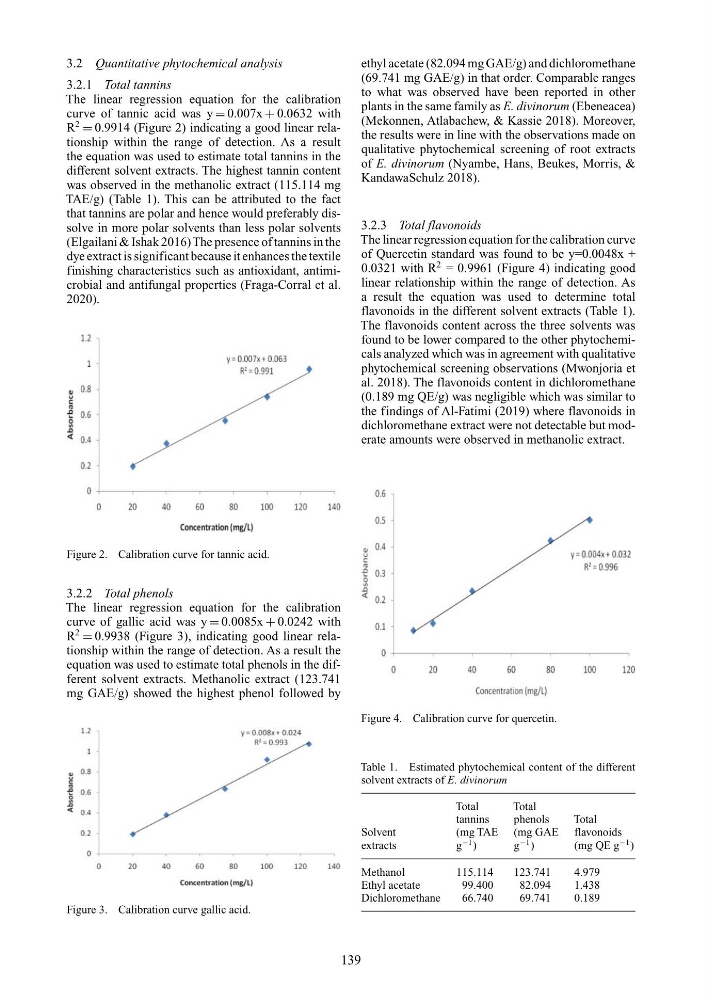
The linear regression equation for the calibration
curve of tannic acid was y = 0.007x + 0.0632 with
R
2
= 0.9914 (Figure 2) indicating a good linear relationship within the range of detection. As a result
the equation was used to estimate total tannins in the
different solvent extracts. The highest tannin content
was observed in the methanolic extract (115.114 mg
TAE/g) (Table 1). This can be attributed to the fact
that tannins are polar and hence would preferably dissolve in more polar solvents than less polar solvents
(Elgailani & Ishak 2016) The presence of tannins in the
dye extract is significant because it enhances the textile
finishing characteristics such as antioxidant, antimicrobial and antifungal properties (Fraga-Corral et al.
2020).
Figure 2. Calibration curve for tannic acid.
3.2.2 Total phenols
The linear regression equation for the calibration
curve of gallic acid was y = 0.0085x + 0.0242 with
R
2
= 0.9938 (Figure 3), indicating good linear relationship within the range of detection. As a result the
equation was used to estimate total phenols in the different solvent extracts. Methanolic extract (123.741
mg GAE/g) showed the highest phenol followed by
Figure 3. Calibration curve gallic acid.
ethyl acetate (82.094 mg GAE/g) and dichloromethane
(69.741 mg GAE/g) in that order. Comparable ranges
to what was observed have been reported in other
plants in the same family as E. divinorum (Ebeneacea)
(Mekonnen, Atlabachew, & Kassie 2018). Moreover,
the results were in line with the observations made on
qualitative phytochemical screening of root extracts
of E. divinorum (Nyambe, Hans, Beukes, Morris, &
KandawaSchulz 2018).
3.2.3 Total flavonoids
The linear regression equation for the calibration curve
of Quercetin standard was found to be y=0.0048x +
0.0321 with R
2 = 0.9961 (Figure 4) indicating good
linear relationship within the range of detection. As
a result the equation was used to determine total
flavonoids in the different solvent extracts (Table 1).
The flavonoids content across the three solvents was
found to be lower compared to the other phytochemicals analyzed which was in agreement with qualitative
phytochemical screening observations (Mwonjoria et
al. 2018). The flavonoids content in dichloromethane
(0.189 mg QE/g) was negligible which was similar to
the findings of Al-Fatimi (2019) where flavonoids in
dichloromethane extract were not detectable but moderate amounts were observed in methanolic extract.
Figure 4. Calibration curve for quercetin.
Table 1. Estimated phytochemical content of the different
solvent extracts of E. divinorum
Total
Total
tannins
phenols
Total
Solvent
(mg TAE (mg GAE flavonoids
extracts
g
−1 )
g
−1 )
(mg QE g
−1 )
Methanol
115.114
123.741
4.979
Ethyl acetate
99.400
82.094
1.438
Dichloromethane
66.740
69.741
0.189
139
3.2.1 Total tannins
The linear regression equation for the calibration
curve of tannic acid was y = 0.007x + 0.0632 with
R
2
= 0.9914 (Figure 2) indicating a good linear relationship within the range of detection. As a result
the equation was used to estimate total tannins in the
different solvent extracts. The highest tannin content
was observed in the methanolic extract (115.114 mg
TAE/g) (Table 1). This can be attributed to the fact
that tannins are polar and hence would preferably dissolve in more polar solvents than less polar solvents
(Elgailani & Ishak 2016) The presence of tannins in the
dye extract is significant because it enhances the textile
finishing characteristics such as antioxidant, antimicrobial and antifungal properties (Fraga-Corral et al.
2020).
Figure 2. Calibration curve for tannic acid.
3.2.2 Total phenols
The linear regression equation for the calibration
curve of gallic acid was y = 0.0085x + 0.0242 with
R
2
= 0.9938 (Figure 3), indicating good linear relationship within the range of detection. As a result the
equation was used to estimate total phenols in the different solvent extracts. Methanolic extract (123.741
mg GAE/g) showed the highest phenol followed by
Figure 3. Calibration curve gallic acid.
ethyl acetate (82.094 mg GAE/g) and dichloromethane
(69.741 mg GAE/g) in that order. Comparable ranges
to what was observed have been reported in other
plants in the same family as E. divinorum (Ebeneacea)
(Mekonnen, Atlabachew, & Kassie 2018). Moreover,
the results were in line with the observations made on
qualitative phytochemical screening of root extracts
of E. divinorum (Nyambe, Hans, Beukes, Morris, &
KandawaSchulz 2018).
3.2.3 Total flavonoids
The linear regression equation for the calibration curve
of Quercetin standard was found to be y=0.0048x +
0.0321 with R
2 = 0.9961 (Figure 4) indicating good
linear relationship within the range of detection. As
a result the equation was used to determine total
flavonoids in the different solvent extracts (Table 1).
The flavonoids content across the three solvents was
found to be lower compared to the other phytochemicals analyzed which was in agreement with qualitative
phytochemical screening observations (Mwonjoria et
al. 2018). The flavonoids content in dichloromethane
(0.189 mg QE/g) was negligible which was similar to
the findings of Al-Fatimi (2019) where flavonoids in
dichloromethane extract were not detectable but moderate amounts were observed in methanolic extract.
Figure 4. Calibration curve for quercetin.
Table 1. Estimated phytochemical content of the different
solvent extracts of E. divinorum
Total
Total
tannins
phenols
Total
Solvent
(mg TAE (mg GAE flavonoids
extracts
g
−1 )
g
−1 )
(mg QE g
−1 )
Methanol
115.114
123.741
4.979
Ethyl acetate
99.400
82.094
1.438
Dichloromethane
66.740
69.741
0.189
139