

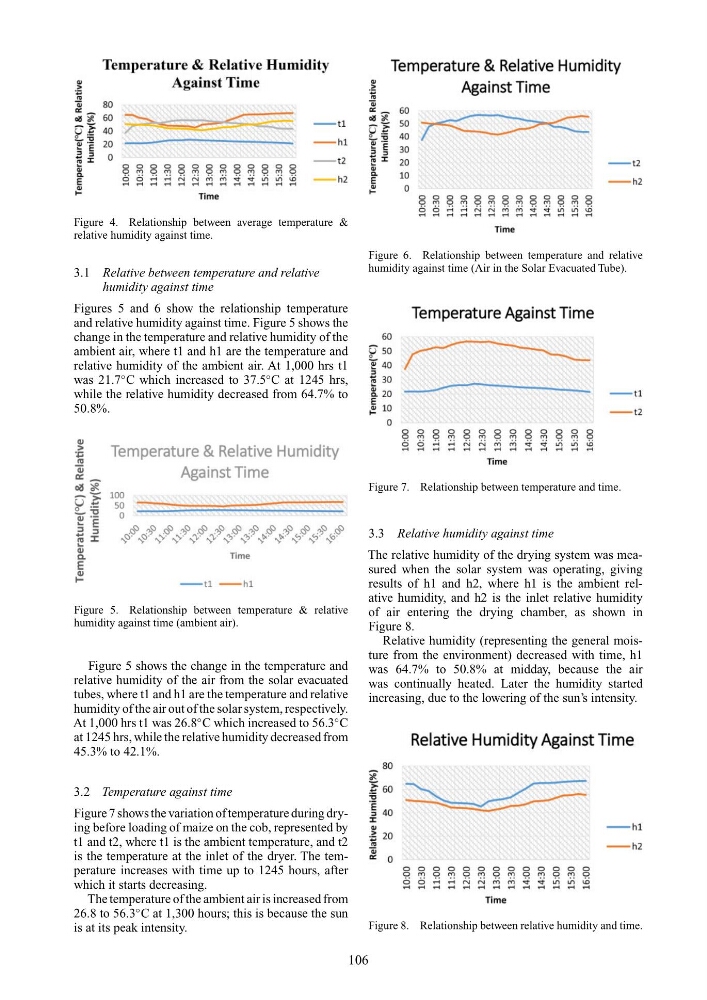
Figure 4. Relationship between average temperature &
relative humidity against time.
3.1 Relative between temperature and relative
humidity against time
Figures 5 and 6 show the relationship temperature
and relative humidity against time. Figure 5 shows the
change in the temperature and relative humidity of the
ambient air, where t1 and h1 are the temperature and
relative humidity of the ambient air. At 1,000 hrs t1
was 21.7
◦ C which increased to 37.5
◦ C at 1245 hrs,
while the relative humidity decreased from 64.7% to
50.8%.
Figure 5. Relationship between temperature & relative
humidity against time (ambient air).
Figure 5 shows the change in the temperature and
relative humidity of the air from the solar evacuated
tubes, where t1 and h1 are the temperature and relative
humidity of the air out of the solar system, respectively.
At 1,000 hrs t1 was 26.8
◦ C which increased to 56.3
◦ C
at 1245 hrs, while the relative humidity decreased from
45.3% to 42.1%.
3.2 Temperature against time
Figure 7 shows the variation of temperature during drying before loading of maize on the cob, represented by
t1 and t2, where t1 is the ambient temperature, and t2
is the temperature at the inlet of the dryer. The temperature increases with time up to 1245 hours, after
which it starts decreasing.
The temperature of the ambient air is increased from
26.8 to 56.3
◦ C at 1,300 hours; this is because the sun
is at its peak intensity.
Figure 6. Relationship between temperature and relative
humidity against time (Air in the Solar Evacuated Tube).
Figure 7. Relationship between temperature and time.
3.3 Relative humidity against time
The relative humidity of the drying system was measured when the solar system was operating, giving
results of h1 and h2, where h1 is the ambient relative humidity, and h2 is the inlet relative humidity
of air entering the drying chamber, as shown in
Figure 8.
Relative humidity (representing the general moisture from the environment) decreased with time, h1
was 64.7% to 50.8% at midday, because the air
was continually heated. Later the humidity started
increasing, due to the lowering of the sun’s intensity.
Figure 8. Relationship between relative humidity and time.
106
relative humidity against time.
3.1 Relative between temperature and relative
humidity against time
Figures 5 and 6 show the relationship temperature
and relative humidity against time. Figure 5 shows the
change in the temperature and relative humidity of the
ambient air, where t1 and h1 are the temperature and
relative humidity of the ambient air. At 1,000 hrs t1
was 21.7
◦ C which increased to 37.5
◦ C at 1245 hrs,
while the relative humidity decreased from 64.7% to
50.8%.
Figure 5. Relationship between temperature & relative
humidity against time (ambient air).
Figure 5 shows the change in the temperature and
relative humidity of the air from the solar evacuated
tubes, where t1 and h1 are the temperature and relative
humidity of the air out of the solar system, respectively.
At 1,000 hrs t1 was 26.8
◦ C which increased to 56.3
◦ C
at 1245 hrs, while the relative humidity decreased from
45.3% to 42.1%.
3.2 Temperature against time
Figure 7 shows the variation of temperature during drying before loading of maize on the cob, represented by
t1 and t2, where t1 is the ambient temperature, and t2
is the temperature at the inlet of the dryer. The temperature increases with time up to 1245 hours, after
which it starts decreasing.
The temperature of the ambient air is increased from
26.8 to 56.3
◦ C at 1,300 hours; this is because the sun
is at its peak intensity.
Figure 6. Relationship between temperature and relative
humidity against time (Air in the Solar Evacuated Tube).
Figure 7. Relationship between temperature and time.
3.3 Relative humidity against time
The relative humidity of the drying system was measured when the solar system was operating, giving
results of h1 and h2, where h1 is the ambient relative humidity, and h2 is the inlet relative humidity
of air entering the drying chamber, as shown in
Figure 8.
Relative humidity (representing the general moisture from the environment) decreased with time, h1
was 64.7% to 50.8% at midday, because the air
was continually heated. Later the humidity started
increasing, due to the lowering of the sun’s intensity.
Figure 8. Relationship between relative humidity and time.
106