

45
Properties of Pesticides and Contaminants
from linearity commonly observed as adsorptive sites on soil become saturated with solute:
x/m = K C
1/n
(3.25)
f
where K f is the Freundlich adsorption isotherm constant. While other adsorption isotherms are theoretically based, the Freundlich isotherm is empirically determined. This may be written in log form for calculations:
log x/m) = log K + 1/n log C
(3.26)
(
f
The plot of log (x/m) vs. log C has a slope of 1/n (n, which has no physical meaning, varies between 0.7 and 1.1) and an intercept equal to log K f . K f
varies from 0.1 (weak adsorption) to 1,000 or more. Contaminants with high
water solubility (S) generally give low K f , and contaminants with low S generally give high K f (Table 3.3).
K f is pH dependent for ionizable solutes, such as phenol whose water solubility increases as pH increases, and the phenolate anion is the dominant
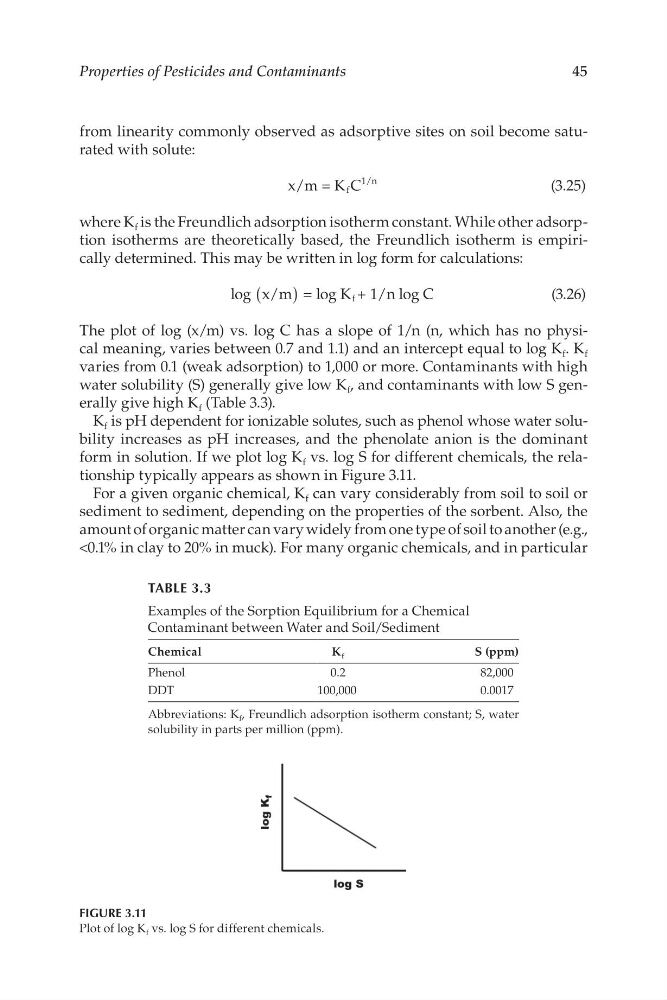
form in solution. If we plot log K f vs. log S for different chemicals, the relationship typically appears as shown in Figure 3.11.
For a given organic chemical, K f can vary considerably from soil to soil or
sediment to sediment, depending on the properties of the sorbent. Also, the
amount of organic matter can vary widely from one type of soil to another (e.g.,
<0.1% in clay to 20% in muck). For many organic chemicals, and in particular
TABLE 3.3
Examples of the Sorption Equilibrium for a Chemical
Contaminant between Water and Soil/Sediment
Chemical
K f
S (ppm)
Phenol
0.2
82,000
DDT
100,000
0.0017
Abbreviations: K f , Freundlich adsorption isotherm constant; S, water
solubility in parts per million (ppm).
FIGURE 3.11
Plot of log K f vs. log S for different chemicals.
Properties of Pesticides and Contaminants
from linearity commonly observed as adsorptive sites on soil become saturated with solute:
x/m = K C
1/n
(3.25)
f
where K f is the Freundlich adsorption isotherm constant. While other adsorption isotherms are theoretically based, the Freundlich isotherm is empirically determined. This may be written in log form for calculations:
log x/m) = log K + 1/n log C
(3.26)
(
f
The plot of log (x/m) vs. log C has a slope of 1/n (n, which has no physical meaning, varies between 0.7 and 1.1) and an intercept equal to log K f . K f
varies from 0.1 (weak adsorption) to 1,000 or more. Contaminants with high
water solubility (S) generally give low K f , and contaminants with low S generally give high K f (Table 3.3).
K f is pH dependent for ionizable solutes, such as phenol whose water solubility increases as pH increases, and the phenolate anion is the dominant
form in solution. If we plot log K f vs. log S for different chemicals, the relationship typically appears as shown in Figure 3.11.
For a given organic chemical, K f can vary considerably from soil to soil or
sediment to sediment, depending on the properties of the sorbent. Also, the
amount of organic matter can vary widely from one type of soil to another (e.g.,
<0.1% in clay to 20% in muck). For many organic chemicals, and in particular
TABLE 3.3
Examples of the Sorption Equilibrium for a Chemical
Contaminant between Water and Soil/Sediment
Chemical
K f
S (ppm)
Phenol
0.2
82,000
DDT
100,000
0.0017
Abbreviations: K f , Freundlich adsorption isotherm constant; S, water
solubility in parts per million (ppm).
FIGURE 3.11
Plot of log K f vs. log S for different chemicals.