

98
Pesticides, Organic Contaminants, and Pathogens in Air
because the more volatile components evaporate frst from the residue on
leaves or foliage. Volatilization represents the primary pathway for dissipation. By day 50, the GC profle shows a shift in favor of more chlorinated
congeners that are less volatile (Figure 6.4b). The capillary GC profle shows
no indication of chemical breakdown because no new peaks are seen in the
weathered material.
6.4 Limit of Detection
The potential pitfalls associated with effciency of sampling and postsampling recovery must be taken into account in validating a sampling protocol (Woodrow et al., 2018). To ensure validity of the analytical methods
used to measure pesticides in air, quality assurance and quality control procedures are required. It is important to consider the limits of detection and
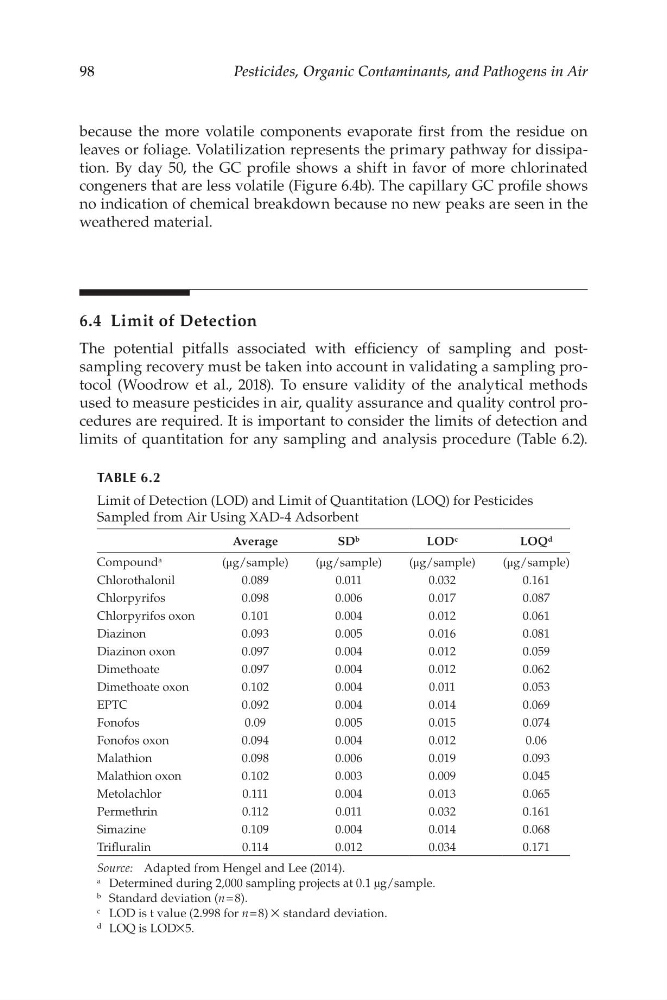
limits of quantitation for any sampling and analysis procedure (Table 6.2).
TABLE 6.2
Limit of Detection (LOD) and Limit of Quantitation (LOQ) for Pesticides
Sampled from Air Using XAD-4 Adsorbent
Average
SD b
LOD c
LOQ d
Compound a
(μg/sample)
(μg/sample)
(μg/sample)
(μg/sample)
Chlorothalonil
0.089
0.011
0.032
0.161
Chlorpyrifos
0.098
0.006
0.017
0.087
Chlorpyrifos oxon
0.101
0.004
0.012
0.061
Diazinon
0.093
0.005
0.016
0.081
Diazinon oxon
0.097
0.004
0.012
0.059
Dimethoate
0.097
0.004
0.012
0.062
Dimethoate oxon
0.102
0.004
0.011
0.053
EPTC
0.092
0.004
0.014
0.069
Fonofos
0.09
0.005
0.015
0.074
Fonofos oxon
0.094
0.004
0.012
0.06
Malathion
0.098
0.006
0.019
0.093
Malathion oxon
0.102
0.003
0.009
0.045
Metolachlor
0.111
0.004
0.013
0.065
Permethrin
0.112
0.011
0.032
0.161
Simazine
0.109
0.004
0.014
0.068
Trifuralin
0.114
0.012
0.034
0.171
Source: Adapted from Hengel and Lee (2014).
a Determined during 2,000 sampling projects at 0.1 µg/sample.
b Standard deviation (n = 8).
LOD is t value (2.998 for n = 8) × standard deviation.
d LOQ is LOD×5.
c
Pesticides, Organic Contaminants, and Pathogens in Air
because the more volatile components evaporate frst from the residue on
leaves or foliage. Volatilization represents the primary pathway for dissipation. By day 50, the GC profle shows a shift in favor of more chlorinated
congeners that are less volatile (Figure 6.4b). The capillary GC profle shows
no indication of chemical breakdown because no new peaks are seen in the
weathered material.
6.4 Limit of Detection
The potential pitfalls associated with effciency of sampling and postsampling recovery must be taken into account in validating a sampling protocol (Woodrow et al., 2018). To ensure validity of the analytical methods
used to measure pesticides in air, quality assurance and quality control procedures are required. It is important to consider the limits of detection and
limits of quantitation for any sampling and analysis procedure (Table 6.2).
TABLE 6.2
Limit of Detection (LOD) and Limit of Quantitation (LOQ) for Pesticides
Sampled from Air Using XAD-4 Adsorbent
Average
SD b
LOD c
LOQ d
Compound a
(μg/sample)
(μg/sample)
(μg/sample)
(μg/sample)
Chlorothalonil
0.089
0.011
0.032
0.161
Chlorpyrifos
0.098
0.006
0.017
0.087
Chlorpyrifos oxon
0.101
0.004
0.012
0.061
Diazinon
0.093
0.005
0.016
0.081
Diazinon oxon
0.097
0.004
0.012
0.059
Dimethoate
0.097
0.004
0.012
0.062
Dimethoate oxon
0.102
0.004
0.011
0.053
EPTC
0.092
0.004
0.014
0.069
Fonofos
0.09
0.005
0.015
0.074
Fonofos oxon
0.094
0.004
0.012
0.06
Malathion
0.098
0.006
0.019
0.093
Malathion oxon
0.102
0.003
0.009
0.045
Metolachlor
0.111
0.004
0.013
0.065
Permethrin
0.112
0.011
0.032
0.161
Simazine
0.109
0.004
0.014
0.068
Trifuralin
0.114
0.012
0.034
0.171
Source: Adapted from Hengel and Lee (2014).
a Determined during 2,000 sampling projects at 0.1 µg/sample.
b Standard deviation (n = 8).
LOD is t value (2.998 for n = 8) × standard deviation.
d LOQ is LOD×5.
c